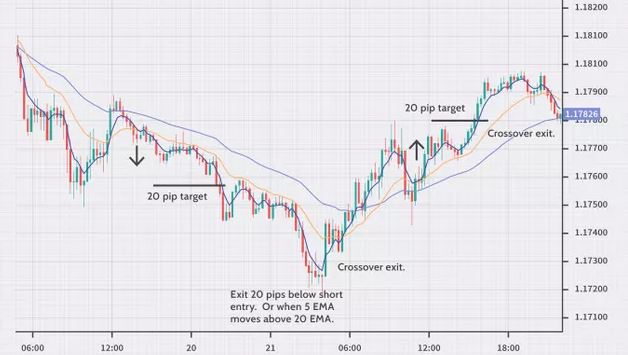
The Exponential Moving Average (EMA) is one of the oldest and most commonly used forex trading tools. Traders incorporate this indicator in charts to get information about price change trends, directions, strengths, and behavior.
Traders also use it to understand the trade’s entry and exit points depending on the position of the price shown on the EMA. For example, if the price sits high on the EMA, the trader considers a sale. Conversely, if the price sits low, the trader considers a buy.
The EMA is designed to smooth out the effects of price volatility to create a better picture of changing price trends. Often, an EMA is used in combination with another EMA for a different period to get signal confirmation of a change in price behavior over time.
EMA and forex trading strategies
1. EMA is one of the most popular indicators in forex trading. One common strategy in forex trading that uses EMA takes a shorter and a longer-term EMA and compares the shorter-term’s position with the longer-term. After this, it makes a trade based on found position.
– Buy Order
If the shorter-term EMA crosses above the longer-term EMA, the trader enters the buy order.
– Sell Order
If the shorter-term EMA crosses below the longer-term EMA, the trader enters the sell order.
2. Another popular strategy that forex traders use to help make trade decisions is using and observing only one EMA indicator about price changes.
– Buyer Side
If the price stays above the chosen EMA level, the trader is on the buyer’s side.
– Seller Side
If the price drops below the chosen EMA level, the trader is on the seller’s side.
Benefits of EMA indicator
One benefit of EMA indicators is that it allows traders to determine if a certain point in time is an outlier compared to the average of the timeframe.
Another important benefit of the EMA indicator is its visual simplicity. The directions on EMA help the traders easily and quickly determine the changes in price behavior.
EMA is a lagging indicator. So, it may not adjust rapidly to the fickleness of the forex market. This should be kept in mind while trading using the EMA indicators.
However, EMA is still faster than SMA under similar settings because, in EMA, the recent price data is given more weightage making it react faster to the price changes.
The similarity between EMA and SMA
– Both the EMA and SMA are used to measure the market trends.
– Both use the same principles to smooth the price fluctuations in a trade.
Differences between EMA and SMA
– SMA calculates the average price data of the entire period. However, EMA gives more weight to the recent price data.
– EMA needs at least ten previous days’ data to calculate current days’ EMA calculation. On the other hand, SMA can work without having the previous data.
– SMA is less sensitive to price changes as compared to the EMA. This sensitivity of EMA increases its speed of detecting trend change compared to SMA.
Limitations of EMA
Though EMA is better and faster than SMA, it still has some limitations. These are:
- It has a lagging indicator because it depends on past price changes. So, it may not adjust rapidly to the changes of the trends.
- Though it uses previous data to calculate current results quickly, it can’t predicate future trends.
- It is vulnerable to false signals.
Bottom line
EMA is one of the most commonly used indicators in the market for stock trading. Like any other indicator, EMA results will never be 100% accurate. Although EMA is vulnerable to false signals, it is a viable tool for forex trading as the positive signals of EMA are consistent enough to give traders an insight into the trends, directions, strengths, and behavior of price changes in the market.

