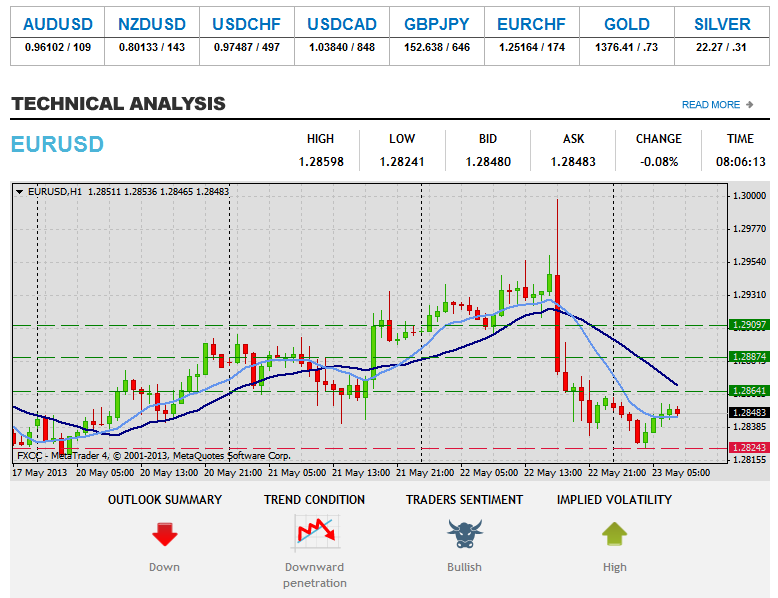
In the world of currency trading, the terms “support” and “resistance” refer to price levels at which a trend reversal is likely to occur. This sort of behavior frequently reoccurs if the currency market’s trend shifts.
Increase the number of support and resistance levels you use when the market is volatile.
Resistance is a price zone that purchasers are psychologically very fearful of. However, buyers are very active when prices are in the support price zone.

Overview on different types of support and resistance types
1. Fixed support and resistance levels
The ratio of support to resistance is fixed and cannot be altered. They are safe until prices either break above or below them.
Emotional or psychological factors, such as round numbers or significant price points from the past (such as all-time highs and lows), can serve as adequate fixed support and resistance levels.
Round figures, such as $100, can positively or negatively affect a stock’s price. Support and resistance levels can be found at specific commodity values, such as $2,000 for gold.
2. Dynamic support and resistance levels
Support and resistance levels, as their names imply, can shift as prices move in either direction. Additional forces enter the equation at these echelons, impacting demand and supply.
Technical indicators like moving averages calculate support and resistance levels using price and time data.
3. Semi-Dynamic support and resistance levels
Semi-dynamic support and resistance levels shift with time and price but at a consistent rate.
Resistance and support lines are dynamic lines drawn using indicators such as trend lines and pivot points. These lines, which indicate price support and resistance, are dynamic and alter over time and price as intended.
When is the best time to use support and resistance levels?
They are helpful when applied in areas where a pattern has emerged. A trader on tradable assets like stocks and indexes can also use it.
Typical time intervals for calculating moving averages include 10, 20, 100, 50, and 200 periods. Potential significance increases with the length of the time window.
How are support and resistance met?
When the trend line breaks through the intersection of the support and resistance lines, it is because of the interaction between the two lines and the trend.
The term for this zone where two trends converge is “convergence area,” traders can use it to anticipate reversals in the primary trend.
How can you identify areas of support and resistance?
The lower low in a fall acts as support, whereas the lower high acts as opposition. What you observe in a climb will be counter to your expectations.

Each new high point acts as opposition, while each unique low point acts as support.
Bottom line
Finally, knowing about support and resistance is crucial to even the most fundamental forex trade knowledge. Mastering this forex indicator is necessary to sell professionally in the foreign exchange market.


