As with many subjects in trading one article could not possibly cover all the intricacies involved, the subject of candlestick charting in trading is one such vast and complex subject. What will follow will be a brief history of the origins of candlesticks in trading, a listing of the key candlestick formations (and their interpretation) and a few ‘kicker’ patterns to look out for that may be the finest illustrations of price action.
Whilst there are many experienced traders who will point to their clean, naked chart containing only candles as a reference to their success, they will also surely openly and humbly admit that candlestick charting is only part their decision making process, it is not infallible and can suffer from exactly the same ‘failings’ and false readings as other methods. As a trader using candlestick charting only you’re looking for a pattern to have developed or to be developing and pattern recognition is statistically unlikely to be any more (or less) reliable than any other preferred methods, it is quite simply the “method” part of the 3Ms.
In this article we’re going to concentrate on certain key candlestick formations, what market information they may be translating and how they can be interpreted. We’ll firstly separate them into potentially bullish and bearish formations. We’ll refer to the term daily throughout our descriptions, whilst opinions may be divided as to whether or not the patterns can be best illustrated on a daily chart, versus four hourly charts or less, for ease of reference and for the purpose of this article we’ll stick to daily. We’re going to concentrate on a handful of formations to potentially whet your appetite.
Whilst the ten bullish and bearish formations briefly discussed in this article cover many of the formations commonly looked for there is a wealth of material freely available that delves into far more detail. There are other significant patterns that many traders look for in conjunction with candlestick formations to give extra confirmation to their trading decisions, similarly traders often enhance the purity of price action displayed by candlesticks by overlapping indicator usage.
History of Candlesticks
Some of the earliest technical trading analysis was used to track prices of rice in Japan in the 17th century, candlesticks use in charting came later, probably beginning after 1850 according to many informed sources. Much of the credit for candlestick charting is attributed to Munehisa Homma, a rice trader from Sakata. Candlestick charts are on record as being the oldest type of charts used for price prediction. In fact, during this era in Japan, Munehisa Homma become a legendary rice trader and legend states that he gained a fortune using candlestick analysis. He was rumoured to have executed over 100 consecutive winning trades.
The candlesticks themselves and the formations they shape were give colourful names by the Japanese traders. Due in part to the military environment of the Japanese feudal system during this era, candlestick formations developed names such as “counter attack lines” and the “advancing three soldiers”. Just as skill, strategy, and psychology are important in battle, so too are they important elements when in the midst of trading battle.
Candlesticks are graphical representations of price movement for a given period of time. They are commonly formed by the opening, high, low, and closing prices of currency pairs. If the opening price is above the closing price then a filled (normally red or black) candlestick is drawn. If the closing price is above the opening price, then normally a green or a hollow candlestick (white with black border) is shown. The filled or hollow portion of the candle is known as body or real body, and can be long, normal, or short depending on its proportion to the line above or below it. The lines above and below, known as shadows, tails, or wicks represent the high and low price ranges within the specified time period. However, not all candlesticks have shadows.


Candlestick charts are much more visually appealing than a standard two-dimensional bar chart. As in a standard bar chart, there are four elements necessary to construct a candlestick chart, the open, high, low and closing price for a given time period. The body of the candlestick is called the real body, and represents the range between the open and closing prices. A black or filled-in body represents that the close during that time period was lower than the open, (normally considered bearish) and when the body is open or white, that means the close was higher than the open (normally bullish). The thin vertical line above and/or below the real body is called the upper/lower shadow, representing the high/low price extremes for the period. The long, dark, filled-in real bodies represent a weak (bearish) close while a long open, light-colored real body represents a strong (bullish) close. It is important to note that Japanese candlestick analysts traditionally view the open and closing prices as the most critical of the day. At a glance, it can be much easier with candlesticks to determine if the closing price was higher or lower than the opening price.
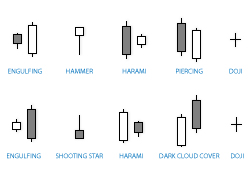
[tabs style=default” title=”Bullish Candlestick Formations”] [tab title=”Engulfing”] Engulfing patterns consist of two candles. The first day’s candle is a narrow range candle that closes down for the day. Sellers are regarded as still being in control of this currency pair, however, given that it’s a small range candle and the volatility appears to be low, the interpretation is that the sellers are not aggressive. The second day gives us better confirmation, we clearly see a wide range candle that completely engulfs the body extent of the previous day’s candle and closes near the top of the range. The buyers have overwhelmed the sellers, quite simply demand is now greater than supply. Buyers are ready to take control of this currency pair.[/tab] [tab title=”Hammer”]
 Hammer candlesticks form when a security moves significantly lower after the open, but rallies to close well above the intraday low. By the end of the day, the buyers have won through and had enough strength to finally close the stock at the top of the range.[/tab] [tab title=”Harami”]
 Harami is a two day pattern that has a small body day completely contained within the range of the previous body, and is the opposite colour. This pattern suggests that the momentum preceding it has stopped. The first day there’s a wide range candle that closes near to the bottom of the range. The sellers are still in control of this security. Then on the second day, there is only a narrow range candle that closes up for the day.[/tab] [tab title=”Piercing”]
 Piercing two-candle reversal patterns occur when on the first day’s candle you see a wide range candle that closes near the bottom of the range, it’s simple and relatively straight forward to spot this bullish two day reversal pattern. The first day, in a downtrend, is a long black day. The next day opens at a new low, then closes above the midpoint of the body of the first day, sellers are in control. The second day a wide range candle forms that has to close at least halfway into the prior candle.[/tab] [tab title=”Doji”]
 Doji is arguably the most popular candlestick pattern given it’s the most easy to spot and provides the basis of the potential for price action many traders look for. Dojis form when a pair’s open and close is virtually static. The length of the upper and lower shadows can vary, the resulting candlestick resembles, a cross, inverted cross, or plus sign. Doji convey a sense of indecision or tug-of-war between buyers and sellers. Prices move above and below the opening level during the session, but close at or near the opening level. The currency pair opens up and goes nowhere throughout the day and closes right at or near the opening price. The most common interpretation is indecision causing traders to question the current trend.
[/tab] [/tabs]
[tabs style=default” title=”Bearish Candlestick Formations”] [tab title=”Engulfing”] A reversal pattern as described previously that in this example is bearish not bullish. The first day’s candle when formed is characterised by a small body, followed by the next day’s candle whose body completely engulfs the previous day’s body.[/tab] [tab title=”Shooting Star”]
 A single day pattern that can appear in an uptrend. It opens higher, trades much higher, then closes near its open. It looks just like the Inverted Hammer except that it is bearish.[/tab] [tab title=”Harami”]
 A two day pattern that has a small body day completely contained within the range of the previous body, and is the opposite colour.[/tab] [tab title=”Dark Cloud Cover”]
 Dark cloud cover is a bearish reversal pattern that continues the uptrend with a long white body. The next day opens at a new high then closes below the midpoint of the body of the first day.[/tab] [tab title=”Doji”]
 Dojis form when a security’s open and close are virtually equal. The length of the upper and lower shadows can vary, and the resulting candlestick looks like, either, a cross, inverted cross, or plus sign. Doji convey a sense of indecision between buyers and sellers. Prices move above and below the opening level during the session, but close at or near the opening level. For bearish doji, in a similar fashion to bullish doji, the trader looks for formation of what they perceive to be the end of the trend. [/tab] [/tabs]
Kickers
Before concluding there’s another pattern many traders look for that can be one of the most recognisable forms of price action, as such a “kicker” is sometimes referred to as one of the most powerful candlestick patterns of all. For fledgling traders, or those new to candlestick charting, I would make the following suggestion as a starting point; bring up several daily charts across the preceding year and see how many times you can spot a similar candle formation to the images below and observe what happened next. I’d also extend that suggestion to all the formations we’ve highlighted.

Recognising the formation of a potential Kicker Signal requires observing the previous day’s candle formation, with the open price, then the closing price continuing in the direction of the existing trend. A bullish kicker is formed after an announcement or some other fundamental ‘event’, a down-trending price alters its direction, opening at the same level or higher than the previous day, a gap can open, and proceeding to close in the complete opposite direction of the previous day. The bearish kicker is formed when the open is at or below the previous day’s bullish candle formation open price and immediately proceeds to go lower. Kicker signals are a powerful candlestick formation and can reap significant profits.


Comments are closed.