In a market where ticker tapes never stand still, scalpers profit from small movements. For years, day traders relied on Level 2 bid/ask screens to detect supply and demand imbalances, which differ from the average person’s National Best Bid/Ask Price (NBBO).
A profit or loss was booked shortly after the spread returned to balanced conditions when technical conditions pushed the bid price higher than usual. A profit or loss was booked when technical conditions pushed the asking price lower than normal.

Scalpers can manage short-term opportunities with three technical indicators tailored for this era. These real-time tools use the same signals used by longer-term market strategies but apply them to two-minute charts instead.
In periods of conflict or confusion, they need to work better; they work best when intraday action follows a strong trend or is strongly range-bound. If your profit-and-loss curve is whipsawing into losses faster than it usually is, you’ll know those conditions are present.
Moving average ribbon entry strategy
A combination of 5-8-13 simple moving averages (SMAs) can be placed against two-minute charts to identify trends that can be traded while also detecting impending trend changes that are unavoidable during any typical market day.
It is easy to master this scalp trading strategy. When prices stay close to the 5- or 8-bar SMA, the 5-8-13 ribbon will align, pointing higher or lower.
Indications of weakness indicate a range or reversal with penetration into the 13-bar SMA. When price swings across these ranges, the ribbon flattens out, and the ribbon may be crisscrossed frequently.
Scalpers then watch for realignment, which involves ribbons rising or falling and spreading out, showing more space between each line. Buying or selling short signals are triggered by this little pattern.
Relative strength/weakness exit strategy
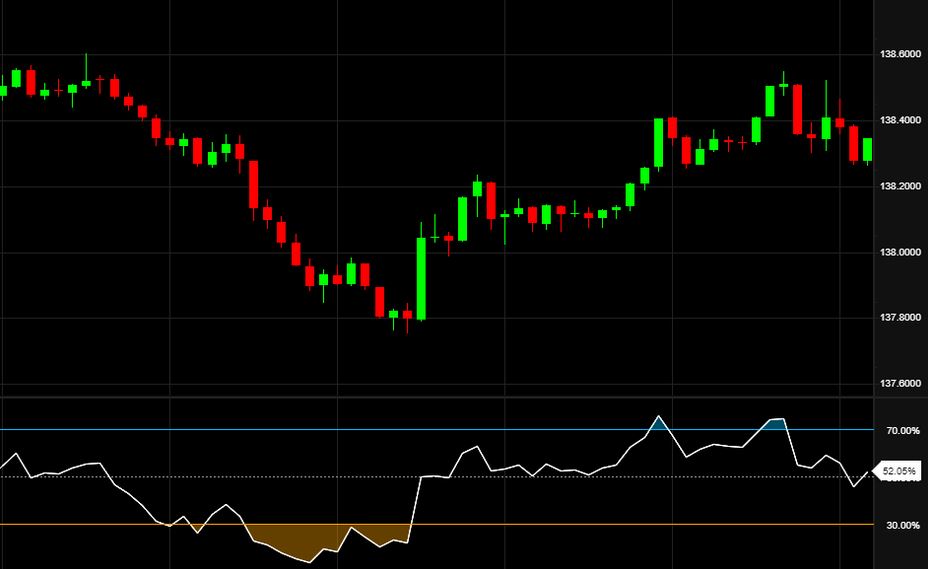
How does a scalper know when to cut losses or take profits? Using a 5-33-3 Stochastic, a 13-bar Bollinger Band, and a ribbon signal on two-minute charts works well for actively traded markets, like index funds, Dow components, and Apple Inc. (AAPL).
When Stochastics turn higher from oversold or lower from overbought levels, the best ribbon trades occur. Similarly, you should exit your position immediately if the indicator crosses and rolls against you after a successful thrust.
When you watch the interaction between the band and price, you can time that exit more precisely. Take profit from band penetrations as they predict a slowdown or reversal of the trend; scalping strategies cannot tolerate retracements.
Stochastics will also advise you to exit if a price thrust fails to reach the band but fails to cross the band, which is a sign that you should take action.
When you’re familiar with the workflow and the interactions between technical elements, you can adjust the standard deviation up or down to account for daily volatility changes. Alternatively, you can overlay your current chart with the additional bands to get a wider range of signals.
Multiple chart scalping
Finally, keep an eye on a 15-minute chart without any indicators to stay on top of background conditions that may affect your intraday performance. A line for the opening print, a line for the high, and a line for the low of the trading range that developed during the first 45 to 90 minutes of trading.
When price action reaches those levels, you can receive larger, two-minute signals. Trading profits are greatest when scalps align with 15-minute, 60-minute, and daily levels of support and resistance during the trading day.

Bottom line
To make several small profits in a typical trading day, scalpers must rely on something other than real-time market depth analysis. Technical indicators tailored to very short timeframes can help them adjust to the modern electronic environment.


