Forex trading might seem like a mysterious world, but fear not! There’s a secret weapon that can transform you into a confident trader: understanding charts! Picture charts as maps revealing how currency prices move over time. By mastering the art of “reading” these maps, you’ll unlock the ability to spot trends, patterns, and the perfect moments to buy or sell.

Chart Basics: Your Forex Roadmap
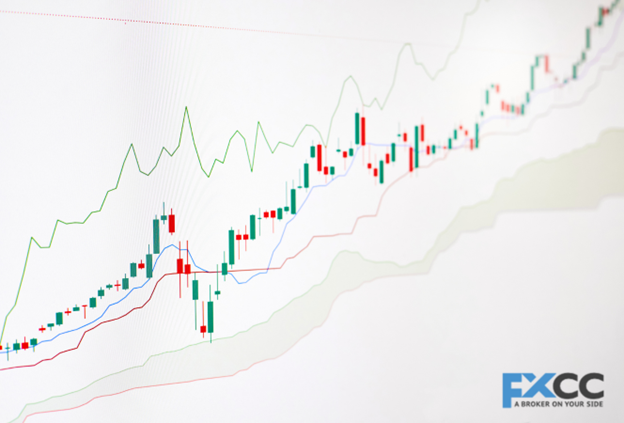
Imagine a forex chart as a picture with two axes. The horizontal line represents time, while the vertical line depicts the price of a currency pair. Within this chart, you’ll notice small bars or candles that signify price movements at different time intervals. These candles tell a story: a green candle signals a price increase, while a red one indicates a decrease. The size of the body (the thick part) reveals the magnitude of the price move.
Why Charting Matters: More Than Just Looking Pretty
Why dedicate time to analyzing these squiggly lines? Here’s the magic: charts serve several purposes:
Spotting the Trend: Charts unveil the overall direction a currency pair is heading: up (uptrend), down (downtrend), or sideways (no clear direction). This insight aids in deciding whether to buy (anticipating a price increase) or sell (expecting a price decrease).
Support and Resistance: Charts unveil zones where prices typically rebound (support) or encounter obstacles (resistance) before reversing. Think of support as a hand lifting a fallen beach ball and resistance as a ceiling it can’t breach. Identifying these areas assists in determining optimal trade entry and exit points.
Trade Timing: Charts reveal recurring patterns in price movements. By recognizing these patterns, you can predict potential price actions and time your trades accordingly. It’s akin to viewing a movie trailer—you glimpse what’s coming and decide whether to watch (buy) or skip (sell) the film.
Your Chart Analysis Toolkit: Essential Tools 101
Now that you grasp the significance of charts, let’s explore tools to decode them:
Moving Averages: Visualize smoothing out the jagged price lines on your chart—enter moving averages. These indicators offer insights into the general trend and hint at potential support and resistance levels.
RSI (Relative Strength Index): This tool measures the strength of price movements. A high RSI suggests an overbought currency (pricey) due for a decline, while a low RSI indicates an oversold currency (cheap) likely to rise. It’s akin to a gas gauge for currency—full tank (high RSI) or empty tank (low RSI).
Fibonacci Retracements: Utilizing a mathematical sequence, this tool predicts areas where price trends may pause or reverse. Don’t fret about the math—most charting platforms handle the calculations for you.
Bollinger Bands: Envision two elastic bands encircling price movements on your chart—these are Bollinger Bands. They illustrate price volatility. Wider bands signal heightened volatility, while narrower bands denote stability. This insight aids in anticipating potential price shifts.
Benefits of Chart Mastery: Become a Forex Trading Hero!
Mastering chart analysis offers more than just bragging rights:
Confidence Boost: Understanding charts enables you to base trading decisions on knowledge rather than intuition, fostering confidence in your trades.
Sharper Predictions: By analyzing charts, you can make more accurate forecasts regarding currency price movements, facilitating informed trading decisions.
Risk Management Proficiency: Chart analysis empowers you to set “stop-loss” orders to automatically sell if prices move against you, limiting potential losses. You can also establish “take-profit” orders to secure gains when prices hit your target.

Conclusion: Charting the Path to Success
Chart analysis isn’t about memorizing intricate formulas—it’s about learning to “see” the story conveyed by charts. The more you practice analyzing charts, the better you’ll become at recognizing trends, patterns, and potential trading opportunities. So, grab your virtual map (your forex chart) and embark on your journey toward becoming a confident and successful forex trader!

