Whenever there is a reduction in the value of your stock, you might wonder whether it is long-term or a blip in the market. Several people even sell the stock in such cases. But, only a few days later, it reaches new highs. It is a popular and annoying type of situation.
I believe it is difficult to get out of such a situation. However, if you’re familiar with trade retracements and reversals, you might be able to handle it. Then, you’ll start discerning improvements in performance. Let’s plunge into it.

Trend Retracement
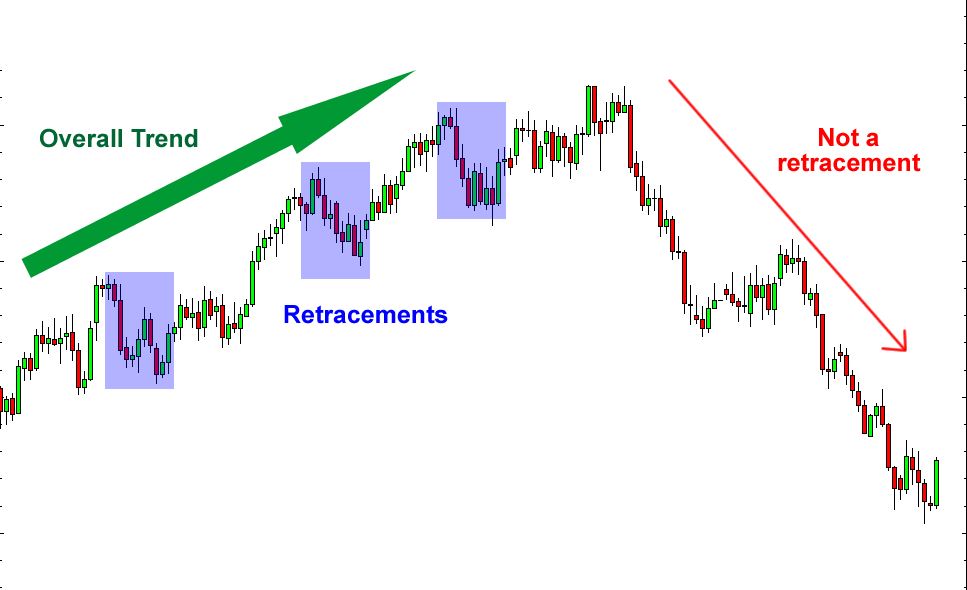
Retracements are transitory price reversals that occur within a broader trend. These price reversals are short-lived and do not imply a shift in the underlying trend.
Whenever the price rises, it establishes a new high. Then, it starts to rally before returning to the previous low when it falls. This activity is a precept of an uptrend, in which there are higher highs and lower lows.
While this is happening, the trend is upward. Only when an uptrend makes a lower low and lowers high is something wrong. This implies a trend reversal.
Trend reversal
A reversal occurs when an asset’s price trend reverses. It implies that the price will most likely remain in the reverse direction for a longer duration. But, the price may also return to the previous position in a pullback.
At first glance, you might not be able to tell whether it is a pullback or a protraction of the reversal. This is because the change can occur suddenly or gradually.
Main distinctions between retracement and reversal
It is critical to understand the difference between a retracement and a reversal. When classifying a price movement, you should consider a few key differences between the two.
Interest
There is still buying interest during a retracement. However, there is little or no buyer interest in case of reversal.
Chart pattern
Also, unlike a reversal, there are no reversal chart patterns during a retracement. This is because the fundamentals do not change during a retracement as they do in reversals.
Timeframe
A retracement can last up to 2 or 3 weeks, whereas a reversal can last several weeks or months.
Candlestick charts
The candlestick charts during a retracement show a bunch of indecision candles with long tails and tops. A reversal, on the other hand, is characterized by reversing candles.
Recent activity
A retracement usually occurs right after large gains. On the contrary, a reversal can happen absolutely at any time.
Volume
Retracements entail small block trades where retail traders are profiting. In the event of a reversal, large block trades, i.e., institutional selling, occur.

Bottom line
The primary distinction between the two is that retracements are momentary and short-lived. A reversal occurs when the trend changes course. They imply that prices will continue to move in the new direction for a prolonged period. You must learn to distinguish between retracements and reversals as a trader. Knowing about these, you can secure yourself from potential dangers. Otherwise, you have the risk of squandering opportunities.

