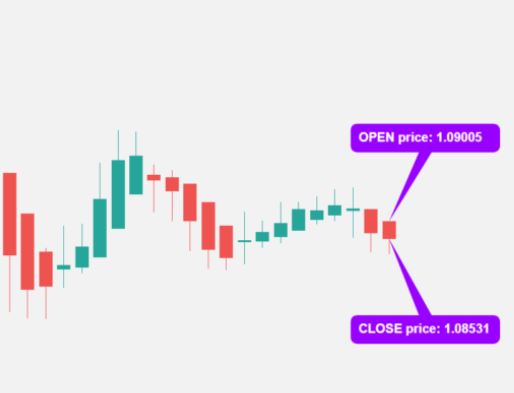
Heikin-Ashi is a Japanese technical trading technique representing and visualizing market prices using candlestick charts. This method uses average price data to filter out market noise, and it is used to identify market trend signals and forecast price movements.
It is easier to determine potential price movements without market noise. Using this trading technique, traders can determine when a trade should be held, when a trade should be paused, or if a reversal is about to happen. Traders can adjust their positions accordingly, avoiding losses or locking in profits.

Heikin-Ashi Indicator Signals
With the Heikin-Ashi technique, the market trend is reflected through indicator signals. There are two aspects to the Heikin-Ashi indicator signals: trend strength and trend reversals.
Trend Strength
It is essential to measure the strength of the trend. Small consolidations and corrections may not be visible due to the smoothing effect of the indicator. As a result, to increase the rewards of trading within a trend with the Heikin-Ashi technique, a trailing stop should be used. To profit from a strong trend, traders should stay in it. Here are some types of Heikin-Ashi trends:
Bullish trend: Many consecutive green candlesticks without lower shadows indicate a strong upward trend.
Bearish trend: The formation of consecutive red candlesticks without upper wicks indicates a strong downtrend.
Triangles:
Indicators of Heikin-Ashi include ascending triangles, descending triangles, and symmetrical triangles. If the indicator breaks above the upper boundary of an ascending or symmetrical triangle, the uptrend will likely continue. The bearish trend will continue and strengthen if candles drop below the bottom line of the descending triangle.
Trend Reversal
When traders recognize a trend reversal signal, they can enter a new trend instead of exiting a previous trend-following trade.
Doji candlestick:
Heikin-Ashi candlesticks have a small body and long shadows. They indicate market uncertainty or, if a trend reversal occurs, a trend reversal.

Wedges:
The rising wedge indicator requires the trader to wait until the candlestick breaks below the indicator’s bottom line. Wedges are similar to triangles, but candlesticks can also form them. When a falling wedge appears, the trader should wait to see the price break above the upper line to reverse the downtrend.
Heikin-Ashi Technique Benefits
Accessibility:
There is no need to install any software to use the Heikin-Ashi indicator, and it is available on all trading platforms without installation.
High chart readability:
Heikin-Ashi candlestick charts are more accessible to interpret than traditional candlestick charts. Thus, it is easier to identify market trends and movements with Heikin-Ashi candlestick charts.
Reliability:
The Heikin-Ashi indicator is a strong indicator that provides accurate results based on historical data.
Filtering of market noise:
Indicators make signals more transparent by filtering market noise and reducing small corrections. By smoothing out market noise, they make it easier to identify trends. The Heikin-Ashi technique helps traders plan their entry and exit points more efficiently since markets are noisy nowadays.
Ability to combine with other indicators:
The Heikin-Ashi indicator provides even stronger signals when combined with other technical indicators.
Timeframe tolerant:
You can use the technique on any time frame, including hourly, daily, monthly, etc. However, more oversized time frames are more reliable.
Bottom line
As a result, Heikin Ashi charts offer a more accurate and smooth representation of price trends, making it easier for traders to identify market trends, reversals, and entry and exit points. Compared to traditional candlestick charts, they can help reduce market noise and effectively emphasize the prevailing market sentiment.


