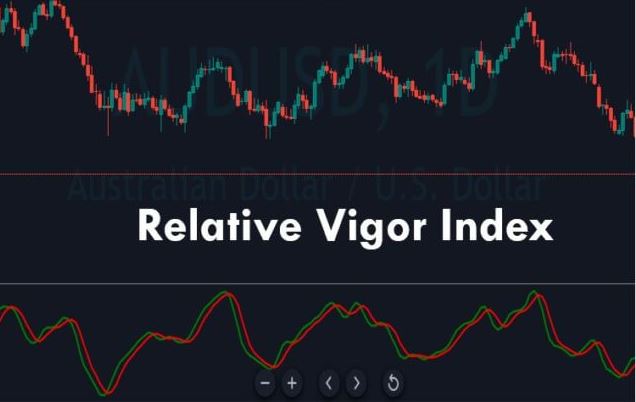
A relative strength indicator (RVI) compares a security’s closing price to its trading range and then smoothes the results with a simple moving average (SMA). It is used in technical analysis to measure trend strength.
In an uptrend, RVI’s usefulness stems from the observed tendency for prices to close higher than they opened; in a downtrend, RVI’s usefulness stems from the observed tendency for prices to close lower than they opened.

How Does the Relative Vigor Index (RVI) Work?
Like the stochastic oscillator, RVI measures the close compared to the open rather than comparing the close to the low. When a bullish trend gains momentum, traders expect RVI values to rise since the closing price of a security is near the top of the range while its open price is near the low.
Like many other oscillators, including the moving average convergence-divergence index (MACD) and relative strength index (RSI), RVI can also be interpreted similarly. It is important to interpret oscillators in a broad context to be actionable; even though oscillators tend to fluctuate between set levels, they may remain at extreme levels for a prolonged period.
RVIs are centered oscillators, not banded oscillators (trend-following), which means that they move around a center line instead of the actual price on a chart rather than around its actual price. Using the RVI indicator with other technical analysis methods will help you determine what will likely happen.
Example of How To Use the Relative Vigor Index (RVI)
By using the RVI indicator in combination with traditional trendlines and chart patterns, traders can identify potential changes in a trend by looking for divergences from the current price.
In terms of trading signals, these are the two most popular:
- RVI Divergences:
An RVI indicator diverging from price indicates a near-term trend change in the opposite direction. If the currency price is rising and the RVI index is falling, it will likely reverse soon.
- RVI Crossovers:
Like many oscillators, an RVI has a signal line, usually calculated with price inputs. Crossovers above the signal line indicate a bullish trend, while crossovers below the signal line indicate a bearish trend. Crossovers act as leading indicators of price direction in the future.

How to calculate RVI
The formula for calculating the Relative Vigor Index (RVI) is as follows:
RVI = (Close – Open) / (High – Low) * V
Where:
- C/Close: current closing price
- O/Open: current period’s opening price
- H/High: current period’s highest price
- L/Low: current period’s lowest price
- V: Current period volume
RVI values are smoothed with a moving average after being calculated over specific periods, usually 10 or 14, to eliminate noise or fluctuations in the data.
Consider a scenario where you want to calculate the RVI for five periods; here’s how you would do it –
- For each period, compute the difference between the closing and opening prices (R1 = C1-C2).
- For each period (H1-L1), calculate the price range.
- Calculate the Relative Vigor Index for each period (RV1 = R1 / (H1 – L1) * V1 and so on).
- Using a moving average over five periods, smooth the RVI values
Limitations of Using the Relative Vigor Index (RVI)
A more extended lookback period reduces the impact of whipsaws and short-term countertrends and helps the RVI perform best in trending markets. However, the RVI can generate false signals in rangebound markets.
Bottom line
As a technical momentum indicator, the Relative Vigor Index (RVI) measures how strong a trend is. Rather than oscillating along a banded trend, the RVI oscillates between two predetermined center lines. A divergence between RVI and price suggests an imminent change in trend.


