The VSA (Volume Spread Analysis) trading strategy analyzes the relationship between price movement, volume, and spread. In the VSA context, the term spread refers to the difference between the high and low prices in the financial market. Richard Wyckoff designed This trading system in the early 20th century, popularized by Tom Williams in the following years.

VSA trading strategy consists of the following components and principles:
Volume analysis
To gain valuable insight into market dynamics, VSA emphasizes trading volume analysis. Forex has no real market volumes but only tick volumes, making it difficult to analyze. By observing changes in volume, traders attempt to gauge the strength of price movements and the involvement of different market participants. Indicators today, however, translate the volume of future instruments into Metatrader. This method can also be used because currency futures prices are derived from currency pricing.
Spread analysis
In VSA, the spreads between high and low prices for a particular period are also considered. In contrast, narrow spreads may indicate indecisiveness in the market or decreased activity. Wide spreads indicate increased buying or selling pressure.
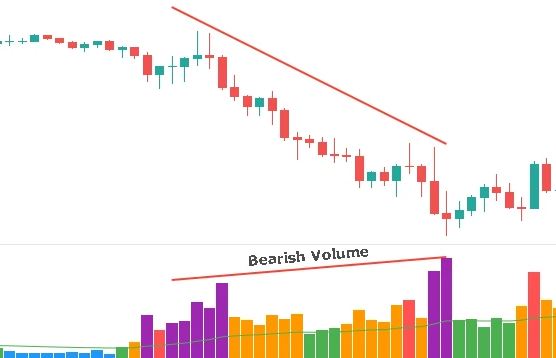
A significant increase in volume during a price advance indicates strong buying interest, while a significant rise during a price decline indicates intense selling pressure. Traders look for situations that indicate possible reversals or continuations when the effort (volume) does not match the expected outcome (price movement).
Upthrusts and springs
A VSA pattern is an upthrust that occurs when prices briefly move above resistance levels but fail to sustain the upward momentum and close lower. On the other hand, an upthrust is a brief drop below a support level that quickly reverses and closes higher. Such reversal patterns indicate the potential for reversals.

No-demand and no-supply bars
It is expected to observe these candlestick patterns in VSA. There is no demand if prices close near the high with low volume. There is no supply if prices close near the low with low volume, indicating no selling pressure. These patterns can indicate market turning points.
Confirmation
Trading signals are often confirmed by VSA analysis when combined with other technical analysis tools and indicators. However, traders can also use VSA with trend lines, moving averages, or other indicators to boost their chances of success.
Does VSA work in all markets?
In addition to focusing on price and volume, VSA seeks to identify professional traders. As long as professionals dominate a market and offer reliable price and volume data, VSA is valid.
The same seems true for almost all financial markets (stocks, futures, forex).
Nevertheless, volume in spot forex is a tricky concept. You will not get actual traded volume but tick volume, which measures how often the price ticks up or down. Your source of tick volume should be a reliable proxy for actual volume if you intend to trade spot forex using VSA methods.
Bottom line
The VSA trading strategy is complex and requires experience, practice, and a comprehensive understanding of market dynamics. The purpose of VSA is to provide traders with insight into the intentions of market participants and to make informed trading decisions based on those insights.

