Since throwbacks and their opposites, pullbacks, cause panic and early exits, novice traders hate them the most. You can, however, learn to protect your position effectively and even use these patterns to accumulate profit because they tend to occur relatively often, around 20% of the time.
Within a continuing uptrend, a pullback occurs when an asset pricing chart pauses or drops moderately from recent highs. Retracements and consolidation are similar to pullbacks, so they are sometimes used interchangeably. Pullbacks generally refer to price drops that last for a short period—for example, a few sessions—before the upward trend resumes.

How do you interpret a pullback?
After security has experienced a large upward move, a pullback is generally considered an excellent opportunity to buy. Traders with existing positions may take profit off the table, i.e., sell some or all of their long positions, following a significant rise in an asset following a positive earnings announcement, resulting in a pullback. However, the positive earnings signal indicates that the stock will resume its upward trend.
During a pullback, the price of the currency moves down to a technical support level, such as a moving average, pivot point, or Fibonacci retracement level, then resumes its upward trend. In addition to simply a pullback, traders should watch these key support levels carefully because a breakdown could indicate a reversal.
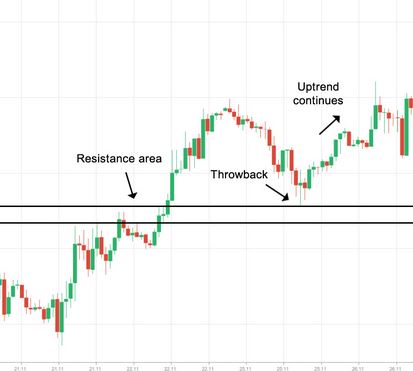
What causes the throwbacks and pullbacks?
Prices surge and break resistance levels when they find resistance, and people who didn’t anticipate a breakout and went short beforehand accumulate losses as prices surge and break resistance levels.
If the price falls back to the previously defined resistance level, people who shorted would want to close their positions as soon as the losses have been minimized. They also bring buying pressure back to the market, which pushes prices up since closing a short position involves buying an asset.
When other market players who have not yet entered the market see that the previous resistance level is supporting, they place long-entry orders (since they saw that the previously established resistance level had rebounded – a bullish signal). A combination of additional buying pressure and short covering could lift the price further and initiate an upward trend.
When you examine previous price charts, you’ll see that these patterns frequently occur. Typically, the areas on the price chart where most people want to make a trade are the most volatile – prices are consolidating, traders are opening or closing positions and stop-loss hunters are lurking. Consequently, if we want to survive longer on the market, we must be comfortable with this volatility and learn to accept that chart patterns rarely match those in textbooks exactly.
Limitations in trading pullbacks
A pullback can be the beginning of a true reversal, the biggest limitation of trading pullbacks. As pullbacks and reversals are common on a range of timeframes, including intraday, if you want to get granular, one trader’s multisession pullback may be a reversal to another trader’s chart. You may look at a reversal rather than a pullback if the price action breaks the trendline for your time frame.
The time is not right for bullish positions in this case. It would be helpful for traders to add other technical indicators and fundamental data scans to their arsenals to help them distinguish pullbacks from true reversals.

Bottom line
After a breakout, the market may retrace back, but do not panic: the initial upward movement will likely resume after the throwback has ended.
Generally, unusually high volume increases the likelihood of a throwback. A throwback is likely to occur when a breakout is accompanied by high volume, e.g., greater than the 30-day average. An above-average volume breakout is three times more likely to lead to this pattern than a below-average breakout. You are a more flexible trader as you can buy right after the price breaks through a support/resistance point and sell after the price peaks before the retracement begins.

