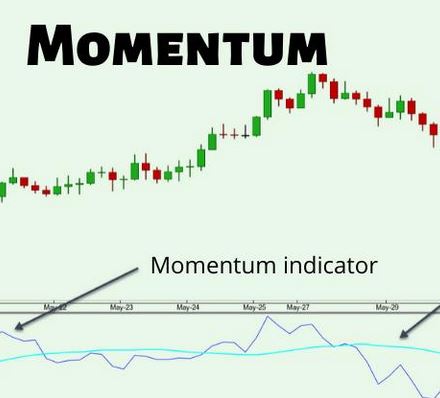
A momentum trade relies on taking advantage of a market’s current trend, which may increase or decrease in price as it gains velocity. The currency and stock markets, volatile and liquid, are the most common markets in which momentum trading occurs.
Momentum traders can also take advantage of price swings in liquid markets, making short trades similar to other short-term trading strategies, such as day trading.

Does momentum trading work?
When you believe in long-term market trends, momentum trading works. It is usually easy to detect them from a few charts – upward price swings can last for several days or weeks, and short squeezes can occur even longer.
A trend, however, does not guarantee that it will last. You risk price corrections and reversals when trading momentum. If a price stalls, selloffs can rapidly snowball, which requires close attention to your trades.
However, momentum trading can also be a long-term strategy, even if it appears to favour short-term traders. In position trading, momentum tends to describe long-term trades, whereas in swing trading, momentum is more short-term, and in day trading, momentum isn’t always the focus.
Using proper indicators and sticking to a strategy can make momentum trading work for all trading styles.
How to use momentum indicators for trading
There are several reasons a price is moving in one direction or another, but most revolve around pure price action. Technical analysis and indicators should be used to implement momentum trading strategies successfully. Take a look at these indicators.
MACD
One of the most popular indicators for technical analysis is the Moving Average Convergence Divergence (MACD). A MACD analyzes price movement based on three exponential moving averages.
Histograms can identify whether a trend is strengthening or weakening based on differences between these averages.
Due to their lag behind price action, moving averages work best for finding entry points for momentum trades since they enter after the trend has started, but exit points may require a different indicator.
Relative Strength Index (RSI)
One of the most popular indicators for momentum trading is the Relative Strength Index. An indicator compares the average number of days that security has closed up versus down signals when a market is oversold or overbought.
The RSI line indicates overbought or oversold conditions when it exceeds 80 or below 20. In this case, momentum traders may want to close their positions at the end of the trend.

Stochastic Oscillator
Indicators such as stochastic oscillators are leading indicators that can predict price movements and exit momentum trades. The indicator has two components: an oscillating line representing the day’s close compared to a 14-day average and a signal line representing the five-day average.
Like the MACD, stochastic oscillators indicate overbought and oversold conditions when they rise above 80 or below 20. It takes things one step further, however, with the stochastic oscillator.
Indicators and signal lines crossover in overbought or oversold regions, signalling an upcoming reversal in the price, and traders anticipate buying or selling accordingly.
How to trade momentum in Forex?
Trading on the Forex market is risky and only suitable for some investors due to the high volatility and the high volume it experiences. The Forex market is much more volatile and has much more volume than the stock market.
A variety of factors trigger Forex market trends. Please be aware that trading during extreme volatility can be risky and unsuitable for everyone.
Several factors can create strong trends in Forex, including reports such as the Consumer Price Index and central bank meeting notes that may signal something new for traders.
The release of important macroeconomic data and global news events can influence Forex price trends. Consumer consumption data, trade deficits, and other macroeconomic data can all impact Forex price trends.


