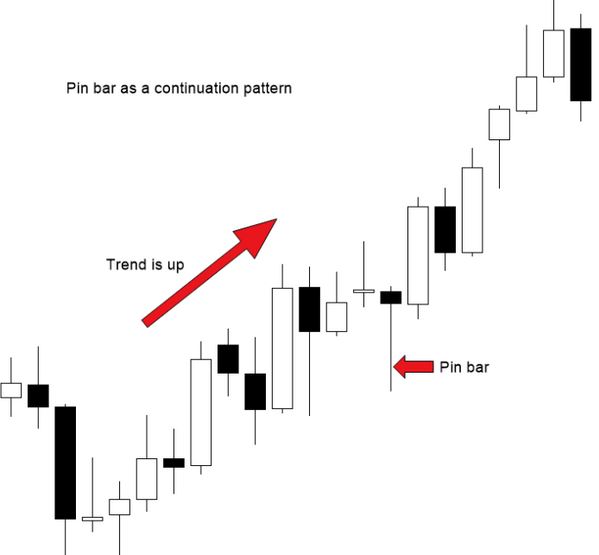
The process is relatively simple when you boil down trading to its most basic elements. An individual trades securities by buying them at a specific price and then selling them at a higher price or by selling them at a specific price and then repurchasing them at a lower price. The process employs various technical and fundamental analyses to determine market momentum and price direction.
Every trader is interested in knowing where the price will go. Since technical analysis involves primarily analyzing historical prices, it’s essential to understand that historical performance does not necessarily predict future performance. Despite its power, the pin bar is a robust set of price action indicators that can point to potential reversals in price movements.

Pin bar history & definition
In his book Pring on Price Pattern, Martin Pring coined the “Pinnochio Bar” candlestick formation. Pinnochio Bars provide high-quality reversal signals when identified and traded correctly. The candle resembles Pinnochio’s nose, which is why Pring originally called it the Pinnochio Bar.
Consider an hourly candlestick. During this period, the bulls appeared to be in complete control of the market as the price increased. Still, the sellers came in with great fury and not only held off the buyers from pushing the price higher but also took complete control of the trading period at some point during this 1 Hour.
During this 1 Hour session, sellers erased all gains made by buyers, and they were even able to push the price below the period open, resulting in a red candle that confirms sellers have complete control of the market.
There is a psychological reason behind the candle: the price “lied” to us. Pinnochio, or pin bar, was the name given to the stock when it tried to fool us into believing it was moving higher when, in actuality, it was moving lower by the end of the session. These pin bars are powerful reversal signals when they form correctly and in the right place.
Not all pin bars are created equal
A pin bar that closes below its open will have an upward wick. If the wick is downward, the bar will close above the open. A pin bar formed at the top of a move and a big wick pointing upward should result in a red candle closing. A pin bar with a big wick to the downside should, however, form at the low of a nice down move, and the body closes green.
The best pin bars will close in the manner just described, and even if they don’t quite make it, it is still okay. Always trade only the best pin bars to maximize your chances of trading success.
Pin bars must have a body that is no more than 20% of their body to wick tip measurement. The candlestick would not be classified as a perfect pin bar if the body is eight pips and the body to the end of the wick is 25 pips.
The body should not exceed 20% of 100 pip, or 20 pip if the wick to the body is 100 pip. You can go up or down a few pips, but it should stay within 20 pips or less.
It is not advisable to have a very long nose. Doji candlesticks have small bodies and equal-sized wicks on each side, so if the nose is too long, they will form a doji candlestick. In a perfect pin bar, the wicks on one side will be very long, and the wicks on the other will be very small or nonexistent.

Bottom line
This article provides general pin bar trading concepts based on forex industry experience. There are no guarantees in trading, even though many traders believe that these chart patterns indicate future price movements. Speculating with your money is risky, and you shouldn’t bet with funds you can’t afford to lose.


