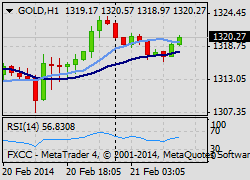
 As we move through an explanation and analysis of the indicators that we favour in our “is the trend still your friend?” weekly trading article, we’re now going to look at one of the simplest, most popular and arguably one of the most powerful indicator trading tools there is – the RSI.
The simple explanation of the RSI is that it translates into graphic form the overall strength of the market in question for any particular security. In terms of sentiment the indicator reveals where investors and speculators may consider a security to be oversold or overbought. It may also reveal, as the indicator moves above or below the median 50 line, the market just beginning to turn from bullish to bearish conditions, or vice versa.
Many traders’ choose to use the RSI in the simplest forms that we’ve already outlined as a ‘stand-alone’ market reference; however, other traders may prefer to use the indicator with a cluster of other popular indicators in order to make an informed decision regarding trade direction. In this article we’ll finish by suggesting two methods to use the RSI; one with other key indicators and the other as a stand-alone tool.
Origins of the RSI
The relative strength index (RSI) is a technical indicator used in the analysis of financial markets. It is intended to chart the current and historical strength or weakness of a market based on the closing prices of a recent trading period.
The RSI is classified as a “momentum oscillator”, measuring the velocity and magnitude of directional price movements. Momentum is the rate of the rise or fall in price. The RSI computes momentum as the ratio of higher closes to lower closes.
The RSI is usually used on a 14 day period, measured on a scale from 0 to 100, with high and low levels marked at 70 and 30, respectively. Shorter or longer timeframes are used for alternately shorter or longer outlooks. More extreme high and low levels—80 and 20, or 90 and 10—occur less frequently but can often indicate stronger momentum.
The relative strength index was developed by J. Welles Wilder and published in a 1978 book, New Concepts in Technical Trading Systems. It has become one of the most popular oscillator indices. Traditionally, and according to Wilder, RSI is considered overbought when above 70 and oversold when below 30. Signals can also be generated by looking for divergences, failure swings and centreline crossovers. RSI can also be used to identify the general trend.
The default period for RSI is 14, but this can be lowered to increase sensitivity or raised to decrease sensitivity. 10-day RSI is more likely to reach overbought or oversold levels than 20-day RSI. The look-back parameters also depend on a security’s volatility.
Trading ideas for RSI
As we’ve previously noted the RSI is considered overbought when above 70 and oversold when below 30. These traditional levels can also be adjusted to better fit the security or analytical requirements. Rising overbought to 80 or lowering oversold to 20 will reduce the number of overbought/oversold readings. Short-term traders sometimes use 2-period RSI to look for overbought readings above 80 and oversold readings below 20.
The simplest and arguably most effective use of the RSI is to go short when the indicator reads 70 and above and go long when the indicator reading falls below 30. However, this simple use can be fraught with hazard given that the security can stay in the overbought or oversold zone for some time requiring cast iron confidence from the trader that we’ve not entered too early. Similarly this strategy requires us to use significant stop losses which can really test the nerves of many traders.
A simple compromise is to only enter the trade when the indicator is exiting from the 70 or 30 levels. But this has the added disadvantage that many traders will feel they’ve then entered the trade too late. The advantage is that this technique should require less of a stop loss. As many of us know there’s no guarantee using such indicators or techniques, therefore the choice of how to use the RSI becomes a very personal issue.
Traders may prefer to turn the use of the RSI on its head, by using a faster setting, such as 5 on the daily time frame, traders may actually go long once 70 is reached and go short when 30 is reached. But exit once the first sign of weakness above these measures is experienced.
For a slightly more complex indicator based strategy then we need look no further than using the MACD and the stochastic lines. We can use this cluster of indicators in two ways. As an example if we’re looking to go long we’d we looking to observe the MACD to just have become positive, the stochastic lines to have crossed and the RSI to be above 50. The position would be reversed if we are looking for short opportunities. If we require greater confirmation then we’d await the MACD to be positive, stochastic lines to have crossed and the RSI to be exiting the oversold area.


Comments are closed.