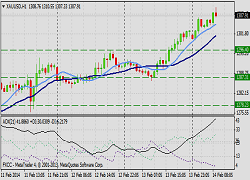
 If you were holding a trading conference and you gathered a group of traders into a hotel bar for a relaxed conversation on all trading related ‘stuff’, to then ask them to nominate “just one indicator that they could rely on, “but only one”, the answers would be revealing.
Firstly you’d have to ban the words “price” or “candlestick”, they are undoubtedly indicators and arguably the best available, but we’re going to let that slide in order to dwell on the subject matter of the article.
We’re going to concentrate on which one they’d nominate, out of the seven main indicators used in our “is the trend still your friend?” weekly trend advice column. It’s a tricky guessing game, but we think the results may come out like this based on the hundreds of chart set ups we’ve seen over the years:
- MACD
- Stochastic
- ADX
- RSI
- Bollinger Bands
- PSAR
- DMI.
Now the DMI is at the bottom of the list as without a doubt it is one of the less popular indicators despite it being very powerful in its ‘ability’ to determine trends and highly rated by many analysts held in high regard in the technical analyst community. Most notably a famous analyst, Charles Le Beau, rates the DMI as the only indicator he’s used that has any likelihood of being reliable. So let’s do the history, the maths and the science behind the indicator, then we’ll move onto the thoughts of Charles Lebeau and then we’ll look at the most basic trading strategy we can recommend, that we also know has some long term proven results to back up its choice.
The DMI, its origins, use and calculation
The Average Directional Index (ADX), Minus Directional Indicator (-DI) and Plus Directional Indicator (+DI) combine as a group of directional movement indicators forming a trading system developed by Welles Wilder. Wilder designed ADX with commodities and daily prices in mind, but these indicators can also be applied to FX and indices with equal accuracy. The Average Directional Index (ADX) measures trend strength without regard to trend direction. The other two indicators, Plus Directional Indicator (+DI) and Minus Directional Indicator (-DI), ideally complement the ADX by helping to define trend direction. Used together, chartists determine both the direction and strength of the trend.
Wilder features the Directional Movement indicators in his famed book New Concepts in Technical Trading Systems. The book also includes details on his Average True Range (ATR), the Parabolic SAR system and RSI. The system consists of three lines:
* The Positive Direction Indicator (+DI) summarizes upward trend movement;
* The Negative Direction Indicator (-DI) summarizes downward trend movement;
* The Average Directional Movement Index (ADX) indicates whether the market is trending or ranging. Welles Wilder does not use the standard moving average formula.
This should be taken into account when selecting indicator time periods.
Charles LeBeau
Is a highly respected futures industry professional with over 40 years of trading experience. He is presently Director of Trading for Tan LeBeau LLC, a hedge fund management company. Chuck is co-author of a best-selling book on futures trading titled Computer Analysis of the Futures Market (McGraw Hill, 1992). This highly acclaimed book has been translated into six languages and is now considered a classic text on how to use technical indicators.
April 15, 2008 By Charles LeBeau;
[quote]I have been trading with Wilder’s Averaged Directional Index (ADX), sometimes known as the Directional Movement Indicator (DMI), for more than twenty years and have written and lectured about my findings throughout the world. I would hope that my public fondness for this indicator has contributed to its increasing popularity among knowledgeable technicians. However I continue to see evidence that the ADX is not well understood and is often used incorrectly.[/quote]
Trading strategy
Go long when +DI is above -DI and either:
* ADX rises while +DI and ADX are above -DI; or
* ADX turns up from below +DI and -DI.
* Exit when +DI crosses below -DI.
* See ADX below for further details.
Go short when -DI is above +DI and either:
* ADX rises while -DI and ADX are above +DI; or
* ADX turns up from below +DI and -DI.
* Exit when -DI crosses below +DI.
* Use stop-losses at all times.
ADX:
Declining ADX shows that the market is losing direction. When ADX falls below both +DI and -DI it signals a lifeless market. Do not trade with DMS until ADX has clearly turned off the bottom. Dr Elder suggests waiting until ADX rises 4 steps off its low (e.g. ADX rises to 19 from a low of 15). The longer that ADX has remained below both +DI and -DI the stronger the subsequent trend is likely to be.
When ADX rises above both +DI and -DI it signals that the market is becoming overheated. Take profits when ADX turns downwards from above +DI and -DI.


Comments are closed.