Understanding the basics of Forex charts is not really that tough. If an individual has had prior experience with charts, then they should be able to read and intelligently predict how the market will fall for the next period. There are basically three types of charts that are often used today: bar, line and candlestick. Each one provides a unique perspective to the Forex trading process. Currently however, the most used type is the candlestick chart, mainly because it is capable of providing more extensive information than the other two.

Prior to using this chart however, individuals must first learn how to read the document and understand the information provided therein.
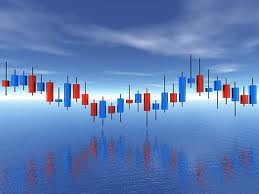
Candlestick Charts
Candlestick charts operate using four basic elements – opening, closing, high and low.
- Open: refers to the first price traded. In the chart, this usually is found along the vertical line; either top or bottom depending on whether it is high or low.
- Close: refers to the last price traded and can be found along the vertical line of the candlestick chart. They are typically the colored area and will show if the candlestick is Bearish or Bullish.
- High: this refers to the highest price traded. This is represented by the long thin lines on the body. They are called “wicks” or “tails”.
- Low: lowest amount traded during the period of the candlestick. Again, they are represented by wicks or tails.


Colors Used
Unlike other Forex charts, the candlestick used color to denote further information. Green is typically used for the Bullish Pattern Candle while the red one is for the Bearish Pattern Candle.
The Bullish type basically means that the price opens near the low price but manages to close near the high price. In reverse, the Bearish candle type denotes that the price opens near the high price and closed when it was near the low price. Note that the red and green coloring process is not permanent. Most traders choose to follow their own color coding techniques, sometimes even adding additional color to depict specific parts of the chart.
What is Their Significance?
Forex charts basically provide traders with historical data that they can analyze in order to better predict the movement of the market. The same is true for the candlestick chart except it is much more comprehensive than the bar chart, hence providing traders with more data to base their decisions on. Through the analysis of the highs and lows in relation to a specific period, traders can easily spot patterns that indicate when they should sell or buy their currencies.

Keep in mind that charts are just one part of the equation. They can provide excellent information regarding the market but other factors may come into play during decision time. Overtime, traders tend to develop their own techniques and watch out for specific signals that will tell them if the market is profitable for them. Using other Forex charts such as bar and line charts would also be helpful in making more accurate decisions.