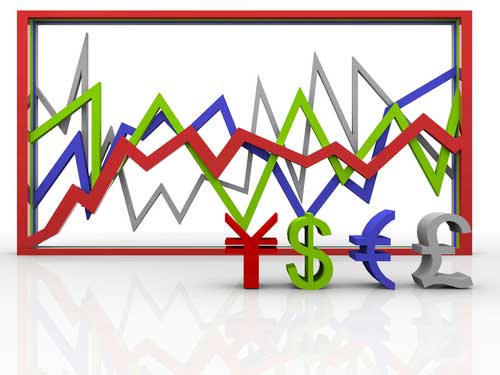
The bar and line Forex charts are two of the most popular charts when it comes to currency trading. Along with the candlestick chart, they are the most often used by traders to study and predict the likely movement of currency prices within the market. This is why the use of charts is so important – in a single glance, traders will be able to see a pattern and make the right decision on their Forex account.
The good news is that learning how to study these charts is not as hard as most people think. For those who want to find out more, here is a breakdown of how the line and bar chart works.
Using Line Forex Charts
The line chart is basically a series of dots connected together to form a line. The horizontal line refers to the date while the vertical line refers to the currency prices. Each currency pair actually comes with its own chart to provide a clearer picture of the situation. The line chart can be set to a short time frame or a long time frame. If the trader wants to study micro changes in the market, then establishing a short-length line chart will be the best idea. Essentially, the line chart makes it possible for traders to notice the relationship between dates and high or peak points in the currency market. The main problem with line charts is that if the market moves too quickly, it would be hard to plot and spot.
Using Bar Forex Charts
Also known as OHLC charts which stand for “Open, High, Low and Close” help individuals watch patterns of prices in relation to their dates and how they opened or closed. They are often read from left to right wherein the bottom denotes the lowest price for a specific time and top line represents the highest price. The horizontal ticks are responsible for the opening and closing time within a specific time. Since the bar chart considers four elements of the trade, most individuals prefer to use this to line charts. The results are much more accurate especially when the information is plotted correctly. This leads to better decisions regarding the Forex trade.
Why Learn Currency Charts?
The reason for wanting to understand currency charts is pretty obvious. With the help of this tool, traders will find it easier to make decisions without compromising the quality of their trades. This method is also ideal for first-time traders or those who are just dabbling in the market. Since the chart is basically a summarized version of trade history, it would not necessitate hours to study the data and arrive at a decision.
Traders can also use the candlestick chart that basically provides the same information as a bar chart. The candlestick however is much more comprehensive and deserves an explanation all on its own. Other Forex charts are available today but so far, the top three are the ones worth learning. Keep in mind that understanding other elements of Forex trading is also important in order to be successful in the venture.


