 After we discover the retail trading industry our natural instinct is to experiment in the market with all the various technical options available on our trading platform. Whereas fundamental analysis requires a completely different skill set in order to learn how to put it to good use, generally after a period of time where it (trading and the wider industry) all begins to make sense, technical analysis is an aspect to our trading that we can (in theory) indulge in with very little or no experience whatsoever. Therefore trading from a technical analysis viewpoint can be a minefield to the very inexperienced which is why we thought we’d cover the subject in a small amount of detail in this column entry.
The ready availability of technical analysis often leads to traders getting in over their head with technical analysis as the tendency is for traders to run before they can walk. So is there a recommended journey into the use of technical analysis, in particular for new traders, that gradually introduces new traders to technical analysis in a calm and measured way? In this column entry we’re going to look at what ‘baby steps’ new traders should take in order to gradually introduce technical analysis into their trading without getting in over their head.
In our “is the trend still your friend?” weekly technical analysis section we deliberately keep our analysis very simple and there are several reasons for this. Firstly, we have to make our analysis readable in English for many of our clients who don’t necessarily speak English as their first language. Secondly, we need to ensure that the analysis is catering for an overall average level of ability, whilst ensuring that the majority of new traders will be able to take something valuable from the analysis. Lastly, our intention is to gradually introduce new traders to indicator based trading which has many critics dismissing it as too simplified to be effective. In particular technical analysis often lags rather than leads, however, indicator based trading is as reliable a tool for swing/trend trading off charts (such as the daily chart) as using many other more complicated trading methods, or using a vanilla chart with nothing other than price on it represented by, for example, Heikin Ashi candles only.
We’re going to highlight a few of the most commonly used indicators, all used in our weekly trend analysis and all left on their standard settings, in order to illustrate how easy it is to build a really simple trend trading strategy that even the most novice traders can use effectively. We’re going to use moving averages, the PSAR, the MACD, the stochastic lines and the RSI. We’ll be using four of the most commonly used indicators with our moving averages. Moreover we’ll be suggesting some interaction with our clients as we’ll be actively encouraging our readers to pull up the relevant chart to fully understand our reasoning.
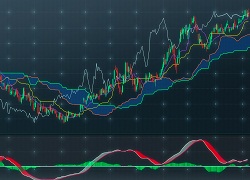
The chart we’d like readers to pull up and concentrate on is the AUD/USD on the daily chart, a security that had witnessed a very ‘good’ bullish trend over recent weeks which may, or may not, have come to an abrupt end over recent weeks. We’d like our readers to activate the PSAR, the MACD, the RSI and the stochastic lines on their charting packages. We’d also like our readers to place the 21, 50, 100 and 200 SMAs on their chart.
Moving averages
Rather than use any form of crossover we’ll be looking at where the most commonly used simple moving averages, or SMAs, are in relation to price on the chart. As we can clearly see price is above all the most commonly referred to SMAs, but threatening to breach the 21 day SMA to the downside.
PSAR
The PSAR is now above price and negative.
MACD
The MACD is now negative and making lower lows using the histogram visual as a guide.
Stochastic lines
On the standard setting of 14,3,3 the stochastic lines have crossed and have exited the overbought area and are mid-way between overbought and oversold conditions.
RSI
The RSI is at 59. It is trending to the downside, but is waiting to cross the ‘critical’ median 50 level which many traders believe separates buyers from sellers when analysing any trading security.
The conclusion
The bearish signals are given off by the MACD and the PSAR, meanwhile the stochastic lines, left on their default setting, are exhibiting bearish tendencies having exited from the overbought area. The MACD is negative and making lower lows using the histogram visual. However, price is still above all the major SMAs, the RSI is yet to cross the median fifty line.
After the huge momentum move to the upside, which began on or around the 5th March, it is somewhat inevitable that the AUD/USD would experience a retracement and slight reversion to the mean average readings. Taking this and the afore mentioned readings into consideration many traders may prefer to wait for a perfect configuration and the majority of the cluster of indicators to be perfectly aligned before committing to the downside. For example traders may wish to sit this apparent break to the downside out until the 50 RSI level is broken and wait until several of the moving averages are breached to the downside; the 21, 50 and 100 as a minimum requirement.
There we go, that’s our really so simple entry level way of using a cluster of indicators to make rational decisions over entering the market and trade management. We’ve deliberately left out any fundamental analysis and not covered money management and where to place the stops given that we’ve covered these two issues recently in our between the lines column.
But what we have here is an effective high probability set up method that can form the bedrock of inexperienced traders’ first venture into trading. You may think it’s too simple but here’s a word or two of caution and encouragement; there’s many a legendary equity or FX trader who has used nothing but two moving averages to make the majority of their decisions and there are many institutional firms whose traders will often refer to the RSI and MACD in the notes they send out to their clients…


Comments are closed.