The RSI is used to measure variation in price between high and low closings. It is a valuable tool for traders when determining entry and exit levels on forex: the index indicates overbought or oversold conditions.
Since the RSI fluctuates between zero and 100, it is classified as an oscillator. An RSI indicator typically draws two lines at the 30 and 70 levels to indicate a warning. In this article, you will find an intraday forex trading strategy using RSI.
What is the relative strength index?
Market conditions are most commonly signaled by the relative index (RSI) when overbought and oversold. RSI indicators can be used to design an intraday forex trading strategy that takes advantage of overextended markets and then exploits the bottoming out process.
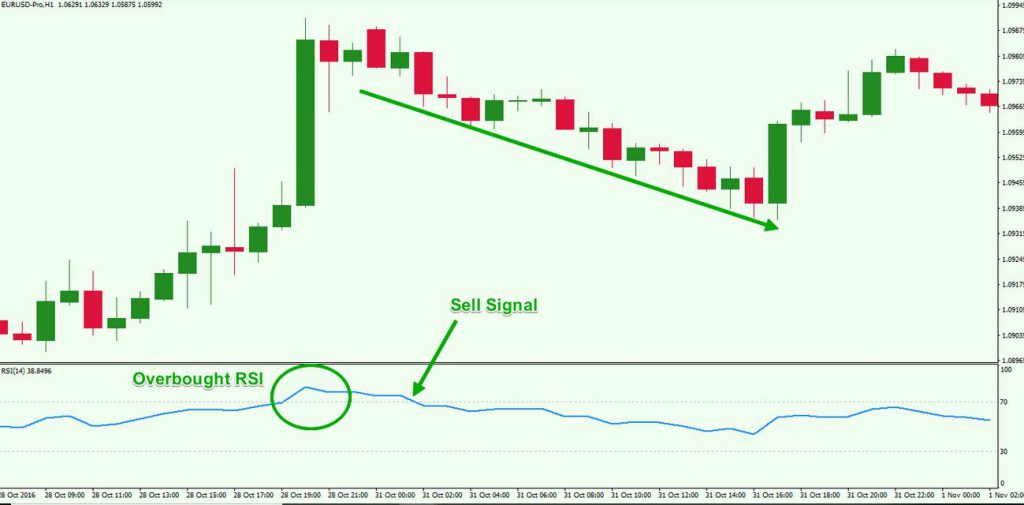
In technical analysis, an oscillator or indicator such as the RSI is widely used. If the RSI reading exceeds 70, then the market is overbought. If it falls below 30, the market is oversold. Traders and analysts with more extreme perspectives tend to use readings such as 80 and 20.
The RSI is susceptible to false signals when trades are made when price movements are abrupt and rapid. For example, these spikes or falls might signal a trading entry or exit point if they show a trading confirmation with other signals.
In general, the price is likely to rise in the future beyond the point where the RSI starts to indicate overbought or oversold conditions. Due to this, using RSI as a trading indicator works better when combined with other technical indicators to minimize the risk of entering a trade too early.
Method to set up trade using RSI
You can implement an intraday Forex trading strategy using the RSI and at least one additional confirming indicator.
- Markets should be monitored for signs of overbought and oversold conditions using the RSI.
- If signs of an impending retracement are not evident, consult other momentum indicators. For example, in the case of an oversold RSI, a retracement to the upside is probably expected but not necessarily confirmed.
When one of these additional conditions is met, it is best to initiate a trade looking to profit from a retracement.
- The first condition is the shift in moving average convergence divergence from price (for example, if the price makes a new low, but the MACD does not, or if the slope changes from down to up).
- The second is Average directional index (ADX) signals where possible retracement could occur.
A stop-loss order should always be placed just above or below the recent low or high price, regardless of whether the trade is short or long. It is advisable to identify the nearest support/resistance level first before setting profits targets.
Bottom line
Trading with the RSI usually involves paying attention to 70 and 30 levels on the indicator. When the RSI exceeds 70, it is considered overbought. A decrease below 30 indicates oversold conditions. Thus, the RSI indicator often serves as a starting point when analyzing a trade, and alerts are placed at the 70 and 30 marks.
If the trader receives an alert, he will examine the validity of the trade. There is the possibility that the RSI could give false signals, and in volatile markets, it is uncommon to see the RSI stay above or below 30 for an extended period.

