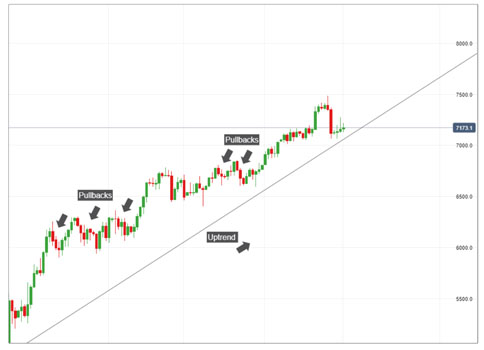
A correction or pullback is a temporary, relatively short-term price movement against an existing trend. The main direction of the price does not change, but some movement against it is formed.
Pullbacks can be small and frequent, or large and rare.
The situation may differ on different timeframes. For example, there is a bullish trend on D1, and if you switch to the hourly chart of the same currency pair, then there will already be a correction; the price temporarily moves down.
Reasons for pullbacks
Profit-taking is often the reason for corrections. Let’s say there was a bullish trend and traders were buying the asset in large volume. The price reached a strong level, where traders began to take profits by closing buy positions. Technically, when you close long positions, a sell-off occurs and under the pressure of sharply increased selling, the price falls and pullback occurs.
A correction can also occur after a sharp jump in prices for the same reason – profit taking. Traders capitalize on the jump and close positions.
Stop-loss hitting is also a common cause of pullbacks. At a certain level, if an accumulation of stop losses is observed and the price hits them, this will cause a short-term market movement against the existing trend.
Pause before the release of important news. Traders can close positions in anticipation of economic statistics or other data that can help them decide whether to buy now or sell.
A short-term change of interests in the market is also the reason for pullbacks. It often happens that under the influence of the same news or other factors, the ratio of buyers and sellers in the market changes for some time. If the trend is bullish, there may be more sellers in the short term. If bearish on the contrary, the initiative can sometimes be intercepted by buyers. A short-term counter-trend movement is formed which is a pullback.
Pullback or trend change?
The question that worries all traders is how to recognize what exactly is in front of them – a pullback or a trend change? No one can reliably say where the price will go at any time, when the trend ends, when it reverses, and so on. All we can do is assume and estimate probabilities.
Here’s a simple example. Let’s say we are trading on a 5 minute chart. This is a low timeframe and trends will change frequently here. What will look like a small correction on the hourly chart, is already quite a trend on the M5. Therefore, if we are talking about low timeframes, then the probability of a trend change or correction tends to approximately 50/50.
Or here’s the daily chart. What is the probability that the trend will change on the daily chart? Quite low, because on such high timeframes, the weather is already made by fundamental factors: the economic, political situation in the country whose currency we trade. Here the speculative factor is practically leveled. Accordingly, trends change with the change in macroeconomic and political factors, rather than the short-term balance of power between buyers and sellers.
What’s the conclusion?
It is that lower the timeframe, the more often trends change there, up to several times a day. This is greatly facilitated by the news and speculation of traders. The older the timeframe, the lower the likelihood of a trend change, because there are already completely different factors that make the weather.

