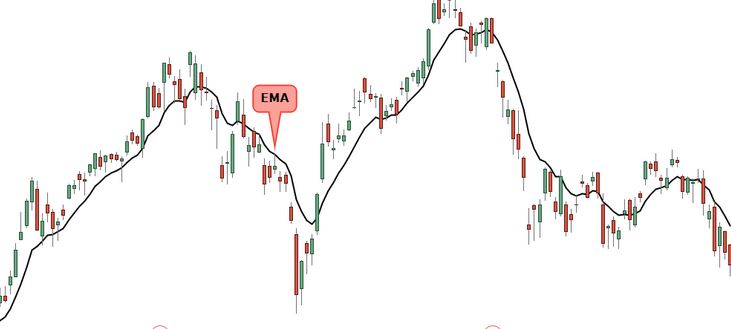
The triple exponential moving average (TEMA) was created to smooth price swings, making it simpler to discern patterns without regular MA lag. It accomplishes this by eliminating some of the lag from several EMA of the original EMA.
In addition, it can assist in determining trend direction, signaling probable short-term trend shifts or pullbacks, and providing support or resistance.
When the price is greater than the TEMA, it aids in confirming an uptrend; when the price is below the TEMA, it aids in the confirmation of a downtrend.

Formula and Calculation for the TEMA
Triple Exponential Moving Average (TEMA)
=(3 * EMA 1) − (3 * EMA 2) + EMA 3
where:
EMA 1 = Exponential Moving Average (EMA)
EMA 2 = EMA of EMA 1
EMA 3 = EMA of EMA 2
What Does the TEMA Display?
The TEMA responds to price fluctuations more quickly than a typical MA or EMA. This is because part of the lag has been eliminated from the computation.
TEMAs can be utilized in the same manner as other MAs. The angle of the TEMA mainly represents the short-term price direction. When it’s angled down, the price falls.
The indicator still has a little latency, so it may not instantly alter its angle when prices move fast. Furthermore, the longer the lookback time, the slower the TEMA adjusts its angle when the price changes direction.
The TEMA and Trend Direction
The position of the TEMA concerning the price also indicates the trend direction. When the price is greater than the TEMA, it helps clarify that the price is growing for that period. When the price falls below the TEMA, it confirms that the price is declining for that period.
If the trader intends to utilize the TEMA to assist spot trends, it is up to them to select the right lookback time for the asset they are trading.
For instance, if the price is above the average and then goes below it, it may suggest that the uptrend is reversing or that a pullback phase is beginning. Conversely, if the price drops below the average and rises above it, it indicates that the price is rallying.
The TEMA for Resistance and Support
The TEMA may also provide price support or resistance. For example, if the price is generally increasing, it may dip to the TEMA on pullbacks and then appear to rebound off of it and continue rising.

If the TEMA is being used for this purpose, it should have previously given support and resistance. If the indicator hasn’t provided support or resistance in the past, it’s unlikely to result in the future.
Finally, some traders employ the TEMA as an alternative to price, often with a short lookback period. But, again, the single line on classic candlestick or bar charts cuts out much of the chaos. In this case, a line chart would suffice.
Bottom Line
With TEMA, price crossings and other indications tend to occur sooner. TEMA is popular among short-term investors because of its low latency and high responsiveness; TEMA should be used with different indications and analytical methodologies, just like any other technical indicator.


