If you still do not know what Japanese candlesticks are, then keep reading and learn what you have missed in your trading so far. Japanese Candlesticks are a type of charting method that is widely used around the world by traders of financial markets. First, let’s take a little historical background.
Who invented the candles?
In the seventeenth century, rice was the main commodity in Japan and already, at that time, the Japanese had a rice exchange. The Japanese created their candlestick school of technical analysis for price changes in rice.
In the decade 1990, a trader and analyst named Steve Nison began to study this ancient Japanese technique, which he learned from a Japanese trader. For several years Steve lived and breathed only Japanese candlesticks, began to write about it, and introduced the Western world of trading to this phenomenon. After that, this technique began to grow in popularity and hence, Steve Nison is called the king of Japanese candles.
So why are they called candles?
Usually, the change in price is represented by line graph where we have no detail whether the price went high or low before closing at certain time. Candles give four reference points on a single time spot and reveal the buying and selling pressure. The shapes formed, comprising of those four reference points, resemble candles having wick and body. That’s why they are candles.
What is forex candlestick analysis?
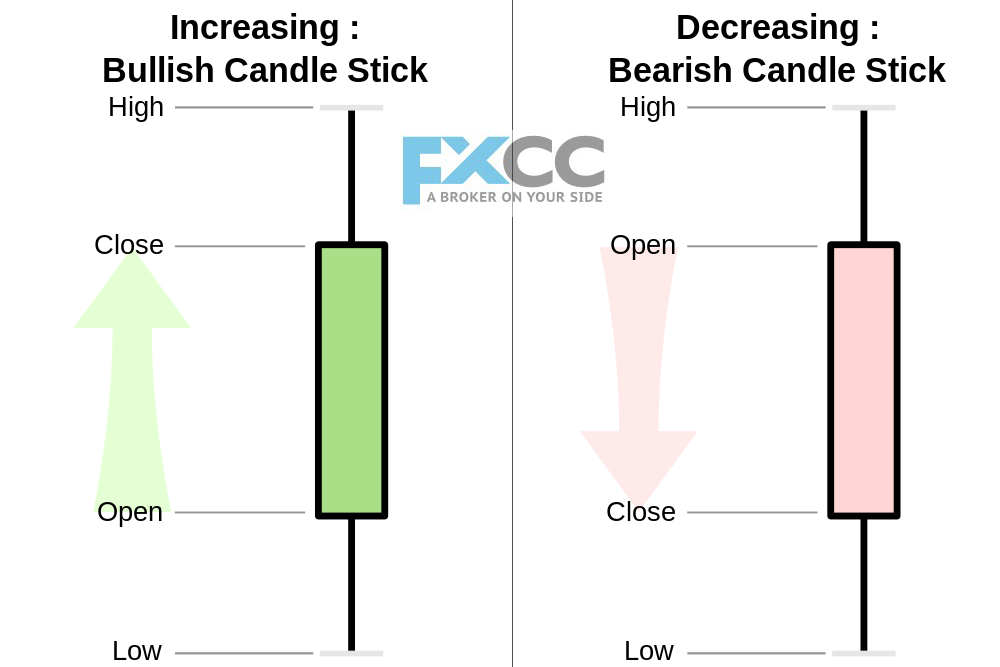
You can use candles in any timeframe. It can be one day, one hour or 15 minutes; it all depends on your needs and trading style. Candlesticks are used to describe price action over a selected time. The candlestick is formed using the open, high, and the close price of the selected time:
- If the close price is above the opening price, then we see an empty candle (usually it is displayed as white)
- If the close price is below the opening price, then we will see a filled candlestick (usually displayed as black)
- The hollow or filled part of the candle is called the body of the candle.
- The thin lines below or above the body show the high/low range and are called shadows.
- The top of the upper shadow shows the maximum price and is the upper level.
- The bottom of the lower shadow shows the lowest price and is the bottom level
Candlesticks form several patterns that are considered bearish or bullish. Traders look for such patterns on different timeframe and use them for trading. The patterns can be reversal or continuation. Reversal patterns help the traders to grab the trend at very early stage and reap nice profit while continuation patterns help to stay within the trend.
For example, if you trade GBP/USD and use 15-minute timeframe, then you have to seen the recent trend of the pair. If it is a downtrend, then wait for a bullish candlestick pattern to appear. Once it appears, you gauge your risk and open the long position. The same can be applied to detect the bearish trend reversal.

