 OK, perhaps we’re exaggerating with the article title there, but if there’s one indicator available from our extensive library that can help swing/trend traders in their quest to follow price, then the PSAR is surely it. Those simple dots that appear above and below price, if used correctly can prove to be one of the most powerful, overlooked and often misused indicators there is.
In terms of being powerful we’ll deal right now with the origins and mathematics involved. For the majority of us we’ll never delve too deeply into the maths, but for clarity and completeness we thought that we’d include it. And we’d like to highlight one key component that users of this indicator should always remember; the SAR is calculated one period in advance. That is, tomorrow’s SAR value is built using data available today. This key ‘ingredient’ has led many users to regard PSAR as one of the select group of indicators that could, and we emphasise “could”, be declared as both a leading and lagging indicator.
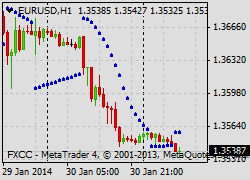
The Parabolic SAR is calculated independently for each trend in the price. When the price is in an uptrend, the SAR emerges below the price and converges upwards towards it. Similarly, on a downtrend, the SAR emerges above the price and converges downwards. At each step within a trend, the SAR is calculated one period in advance. That is, tomorrow’s SAR value is built using data available today. The general formula used for this is:
SAR n+1 = SAR n + (EP – SARn)
Where SARn and SARn+1 represent the current period and the next period’s SAR values, respectively.
EP (the extreme point) is a record kept during each trend that represents the highest value reached by the price during the current uptrend — or lowest value during a downtrend. During each period, if a new maximum (or minimum) is observed, the EP is updated with that value.
As for being overlooked the simplicity involved often leads traders to move past the inherent simplicity onto a strategy containing far more, often unnecessary over complication and sophistication. Similarly many traders fail to use the indicator in its simplest form; be long when it’s below price, short when it’s above and please readers, don’t whatever you do, start tampering with the settings, leave it on the settings that one of the ‘Godfathers’ of the indicator world of invention – J. Welles Wilder designed it to work on.
Origins and workings of the PSAR
The Parabolic SAR (Parabolic Stop and Reverse) is an indicator and can be a standalone trading method devised by J. Welles Wilder, Jr., to find potential reversals in the market price direction of currencies indices and equities. It is a trend-following indicator and can be used to set a trailing stop, or to determine entry or exit points, based on prices historically tending to stay within a parabolic curve when a strong trend is developing.
The concept draws on the idea that “time is the enemy” – unless a security can continue to generate more profits over time, it should be liquidated. The indicator generally works only in trending markets; it creates whipsaws during ranging and sideways phases.
Wilder recommended establishing the direction or change in direction of the trend through the use of Parabolic SAR, and then using a different indicator such as the Average Directional Index to determine the strength of the trend.
Once a downtrend reverses PSAR follows prices like a trailing stop. The stop rises whilst the trend remains in place. PSAR never decreases in an uptrend and continuously protects profits as prices advance. Because PSAR never rises in a downtrend, it continuously protects profits on short positions.
Wilder introduced the Parabolic Time/Price System in his 1978 book, New Concepts in Technical Trading Systems. This book also includes RSI, Average True Range (ATR), and the Directional Movement Concept (ADX). Despite being developed before the computer age, Wilder’s indicators have stood the test of time and remain extremely popular.
Now we’ve discussed the finer details of the indicator we’ll move onto a simple swing trading strategy involving: the Heikin Ashi bars, PSAR, DMI and MACD, with our trade decisions being made from the daily time frame only.
Suggested swing trading strategy using PSAR
- We take trades only on the daily time frame.
- We set an alert to enter when PSAR reverses trend; it switches from the top or bottom over or above price on the previous trend.
- All other indicators must confirm the same trend.
- If we wish to go long PSAR appears below price, MACD should be positive and making higher highs, as should the DMI.
- The daily Heikin Ashi bar will not be closed, given that, in the majority of circumstances, the confluence of indicators will not trigger at the very end of the day’s trading sessions.
- Whatever the temptation we do not take the trade on the basis of the PSAR only, all three indicators must be aligned.
- To close the trade we’re looking for the PSAR to reverse trend and appear above price. This is our signal to close with no exceptions.
- Should price retrace, PSAR once again appears back under price, we can re-enter long again if the other indicators are still positive.
- Alternatively we can wait to see if PSAR stays above price and then we’ll simply await the other indicators to also become negative.