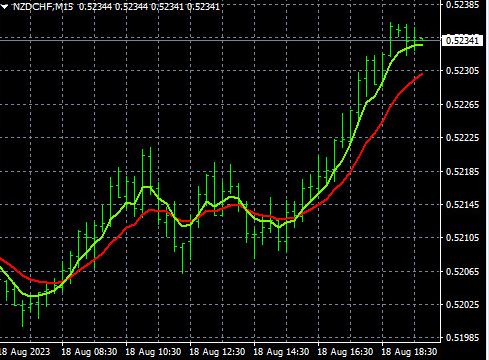
The foreign exchange market, or forex for short, can be a complex beast. Juggling multiple currencies and their ever-shifting values can leave even seasoned traders with a case of information overload. That’s where the forex heatmap comes in – a powerful tool designed to bring clarity and efficiency to your trading decisions.
What Exactly is a Forex Heatmap?
Imagine a visual snapshot of the entire forex market, where colors represent the relative strength (or weakness) of various currencies. That’s the essence of a forex heatmap. By displaying data from numerous currency pairs in a color-coded grid, it allows you to quickly grasp the overall market sentiment at a glance.

How Does it Work?
The heatmap tracks the price movements of major currency pairs. Typically, green shades indicate a strengthening currency against its counterparts, while red signifies weakness. The intensity of the color reflects the magnitude of the price change.
Key Components to Unpack:
- Currency Pairs: The heatmap usually covers major forex pairs like EUR/USD, GBP/USD, and USD/JPY.
- Color Coding: As mentioned earlier, green represents strength, red indicates weakness, and neutral shades depict minimal movement.
- Timeframe: Heatmaps can display data for various timeframes, from short-term (minutes) to long-term (months).
Unlocking the Benefits:
- Swift Market Overview: Gain a quick understanding of which currencies are dominating and which are lagging.
- Informed Trade Selection: Identify potential trading opportunities based on currency strength and weakness.
- Confirmation Tool: Validate your existing analysis by checking the broader market context through the heatmap.
- Spotting Correlations: Uncover relationships between currencies, helping you make more informed decisions.
Reading the Heatmap Like a Pro:
- Focus on Dominant Colors: Look for sections with a clear majority of green or red, indicating strong trends.
- Identify Diagonals: Diagonal patterns might suggest a single currency’s overall strength or weakness.
- Consider Timeframes: Analyze the heatmap across different timeframes for a more comprehensive view.
Practical Tips to Remember:
- Don’t Trade Based on Heatmap Alone: It’s a valuable tool, but integrate it with your existing trading strategy.
- Beware of False Signals: Short-term fluctuations can create temporary heatmap distortions.
- Stay Updated: Ensure your heatmap reflects real-time market data.
Common Mistakes to Avoid:
- Overreliance: The heatmap shouldn’t replace your analysis; it should supplement it.
- Ignoring Fundamentals: Don’t neglect economic factors that can influence currency movements.
- Misinterpreting Colors: A slightly red hue doesn’t necessarily mean a weak currency; consider the overall color scheme.
Integrating the Heatmap into Your Strategy:
- Identify Trending Currencies: Look for persistent green or red to capitalize on potential trends.
- Filter Trade Signals: Use the heatmap to refine entry and exit points suggested by your trading strategy.
- Spot Correlated Pairs: Leverage the heatmap to discover trading opportunities in related currency pairs.
Real-Life Examples:
- Scenario 1: The heatmap shows USD consistently in red across time frames. This might indicate potential shorting opportunities on USD pairs.
- Scenario 2: You’re considering buying EUR/USD. The heatmap reveals overall EUR strength, potentially bolstering your buying decision.
Advanced Strategies for Power Users:
- Heatmap Divergence: Look for discrepancies between the heatmap and price action of a specific pair for potential reversals.
- Customizable Heatmaps: Some platforms allow filtering specific currency pairs for a more targeted analysis.

The Final Word:
The forex heatmap is a valuable tool for any forex trader, offering a quick and insightful view of the market landscape. By understanding its components, benefits, and proper usage, you can leverage the heatmap to make more informed trading decisions and navigate the forex market with greater confidence. Remember, knowledge is power, and the forex heatmap empowers you to see the bigger market picture.
Frequently Asked Questions
1. What is the Forex Heatmap used for?
The Forex Heatmap is used to quickly assess the relative strength and weakness of various currency pairs, helping traders make informed decisions about buying and selling.
2. Can beginners use the Forex Heatmap?
Yes, beginners can use the Forex Heatmap. It’s designed to be user-friendly and provides a straightforward visual representation of market conditions.
3. How often should I check the Forex Heatmap?
The frequency depends on your trading style. Day traders might check it multiple times a day, while long-term traders might review it daily or weekly.
4. Is the Forex Heatmap reliable?
The Forex Heatmap is a reliable tool, but it should be used in conjunction with other analysis methods and not relied upon solely for trading decisions.
5. Can the Forex Heatmap predict market movements?
The Forex Heatmap doesn’t predict market movements but provides valuable insights into current market conditions, helping traders make more informed decisions.


