The GBP/USD is the second most traded currency pair in the global financial markets and one of the most popular among beginner forex traders because of its high levels of liquidity. Although the UK economy no longer has the dominant position it once commanded in the global economy, it is still significant due to London’s remaining one of the busiest trading centers in the world. This means that the UK pound is still an important currency and the third most traded after the US dollar and the Japanese yen.
When trading this currency pair, even technical traders look to fundamental factors to determine when the UK pound or the US dollar might make big moves. For example, the most recent development affecting the pound was the Bank of England’s decision as to whether to raise interest rates or not as well as UK trade data. Since it was widely anticipated by traders that the BoE would leave interest rates alone for the present, there was little volatility in trading of the currency pair, although weaker production and industrial data weighed down the pound. In the event of a surprise decision by the BoE, however, it was widely expected that the pound would spike against the dollar, creating a valuable trading opportunity.
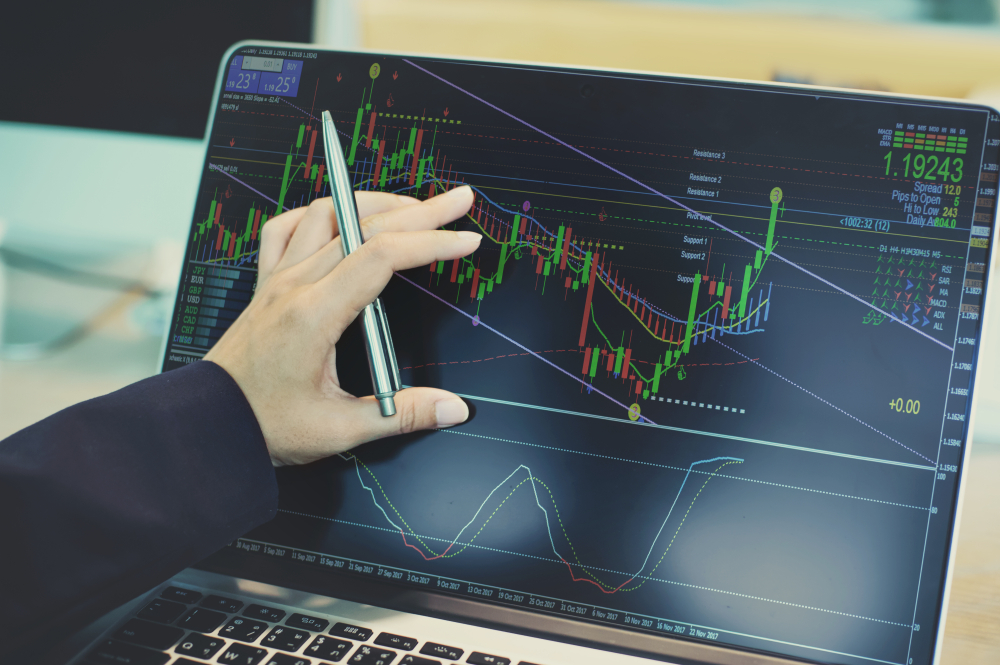
In this case, using a breakout strategy would be more appropriate. Under this strategy, traders are monitoring the support and resistance levels of the GBP/USD, looking for places where the price would break out before establishing new levels. The strategy should also reflect the trader’s risk-reward ratio, i.e. if it is 1:5 then the trader would, for example, be willing to risk 20 pips in exchange for a 100 pip gain. Thus, when setting stop-loss or take-profit levels, the trader should use multiples of the risk-reward ratio based on how much he is trading. For example, if he is risking 60 pips, then this should be multiplied by five or 300 pips to get the profit target.
As always, the trader should start by identifying the support and resistance levels on the charts, and then use technical indicators to look for breakout levels. They should also look at the price trend to determine the general direction in which prices are moving. But the trader should also make sure that a genuine breakout has happened and not just a spike which could send the price back to the old support and resistance levels.

