Introduction to Symmetrical Triangle Pattern
The symmetrical triangle pattern is a popular technical analysis tool used by traders to identify periods of market consolidation before significant price movements. It’s formed by converging trend lines that slope towards each other, reflecting indecision in the market as traders await a breakout. Whether you’re trading stocks, forex, or cryptocurrencies, understanding this pattern can help you make better trading decisions.

What is a Symmetrical Triangle Pattern?
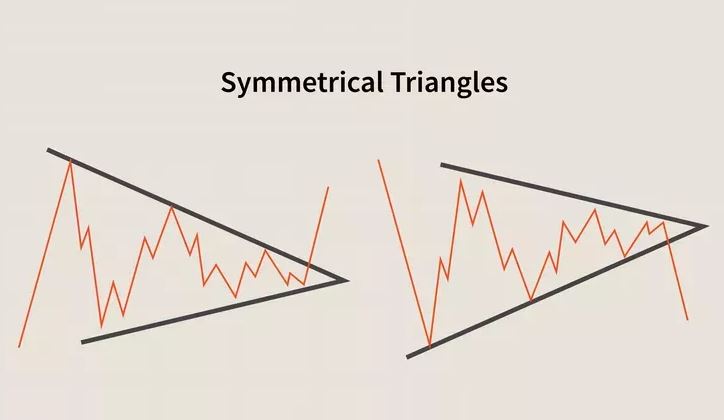
A symmetrical triangle is a continuation pattern that appears when the price fluctuates between two converging trendlines. The pattern suggests that a breakout could occur in the direction of the previous trend. The price moves into a tighter range as buyers and sellers struggle to gain control, leading to a potential breakout that traders can capitalize on.
How Symmetrical Triangle Patterns Form
Symmetrical triangles develop over three phases:
Initial Trend – A strong upward or downward price movement precedes the formation.
Consolidation – The price oscillates between converging trendlines, forming a triangle.
Breakout – The price breaks through one of the trendlines, signaling a potential continuation or reversal.
Bullish vs. Bearish Symmetrical Triangle
In a bullish market, the symmetrical triangle often leads to an upward breakout, continuing the uptrend. Conversely, in a bearish market, the price may break downwards, signaling further declines. However, traders should wait for confirmation before entering trades based on these patterns.
Trading Strategies for Symmetrical Triangle Patterns
Breakout Trading
The most common strategy is breakout trading. Traders wait for the price to break above or below the triangle’s trendlines before entering a trade. If the breakout occurs to the upside, traders enter a buy position. If it breaks to the downside, a sell position is preferred.
To increase the likelihood of success, traders should:
Wait for Confirmation: Look for a significant increase in volume to confirm the breakout.
Use Stop Losses: Place stop-loss orders just outside the opposite trendline to manage risk.
Avoiding False Breakouts
False breakouts happen when the price appears to break through a trendline, only to reverse back into the triangle. To avoid these pitfalls, traders should ensure the breakout is confirmed by a surge in volume and sustained price movement.
Volume and the Symmetrical Triangle Breakout
Volume is a key indicator when trading symmetrical triangles. As the price consolidates within the triangle, volume typically decreases. A significant surge in volume during the breakout strengthens the signal that the price will likely move in the breakout’s direction, providing traders with greater confidence.

Identifying Symmetrical Triangle Patterns
Recognizing the Pattern
To spot a symmetrical triangle, look for a series of lower highs and higher lows, creating a converging shape on the chart. Drawing trend lines connecting the highs and lows will help outline the triangle. Once the price breaks out, traders can use this visual confirmation to execute their strategies.
Using Technical Indicators
While symmetrical triangles are powerful on their own, combining them with indicators like the Relative Strength Index (RSI) or Moving Averages can improve accuracy. These indicators can confirm whether the market is overbought or oversold, providing additional clues on whether a breakout is likely to succeed.
Market Applications of Symmetrical Triangles
Stock Market Trading
Symmetrical triangles appear frequently in stock charts, especially during periods of consolidation after a strong price movement. For example, during Tesla’s consolidation phases, symmetrical triangles often preceded significant price jumps.
Forex Market
In forex, symmetrical triangles are commonly seen on pairs like EUR/USD or GBP/USD. A breakout from the triangle in these pairs can lead to sharp movements, making it an essential pattern for forex traders.
Cryptocurrency Trading
Cryptocurrency traders also rely on symmetrical triangles. For instance, Bitcoin often forms symmetrical triangles before a big price move, allowing traders to profit from the highly volatile market.
Advantages and Limitations of Symmetrical Triangle Patterns
Advantages
Easy to Identify: Symmetrical triangles are simple to recognize, even for beginner traders.
Predicts Big Movements: When used correctly, they help traders anticipate significant price swings.
Limitations
False Breakouts: Traders need to be vigilant about false breakouts, as they can result in potential losses.
Requires Confirmation: The pattern isn’t reliable without volume confirmation, which may lead to missed opportunities if you wait too long.
Common Mistakes Traders Make
Misidentifying the Pattern
One common mistake is confusing a symmetrical triangle with other chart patterns like wedges or pennants. Properly drawing the trendlines and recognizing the shape is essential for successful trading.
Ignoring Volume
A breakout without volume is often a sign of a false move. Always wait for volume confirmation to ensure that the breakout is genuine.
Conclusion: Mastering the Symmetrical Triangle Pattern The symmetrical triangle is a powerful pattern that traders can use to identify potential breakouts in various markets. By understanding how the pattern forms and combining it with proper risk management, volume analysis, and technical indicators, traders can increase their chances of success. However, like any trading strategy, it’s essential to remain cautious, avoiding false breakouts and waiting for clear confirmation.


