In the trading world, making informed decisions based on market movements is crucial. One of the most valuable tools in a trader’s arsenal is the Relative Strength Index (RSI). This article provides an in-depth look at RSI, offering insights into its operation, applications, and strategies for maximizing its use.
Introduction to Relative Strength Index (RSI)
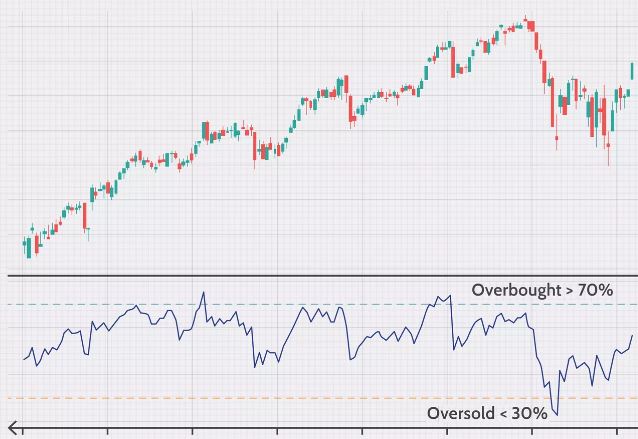
The Relative Strength Index (RSI) is a momentum indicator that measures the rate and magnitude of price movements. Created by J. Welles Wilder Jr., RSI was first introduced in his 1978 book, New Concepts in Technical Trading Systems. RSI ranges from 0 to 100 and is widely used to detect overbought or oversold conditions in a market.

Understanding the RSI Formula
The foundation of RSI lies in its calculation, which involves the following formula:
RSI=100−(1001+RS)RSI = 100 – \left( \frac{100}{1 + RS} \right)RSI=100−(1+RS100)
Here, RS (Relative Strength) is derived by averaging the gains over a specific number of days and dividing it by the average losses over the same period. This ratio provides a clear view of the momentum driving price changes, indicating whether a stock is moving towards being overbought or oversold.
How RSI Works in Trading
RSI is versatile and applicable in various trading strategies. When RSI values surpass 70, it typically indicates that the asset is overbought and might be due for a pullback. On the flip side, when RSI values fall below 30, it suggests the asset is oversold and could be primed for a rebound. This straightforward yet powerful indicator enables traders to make informed decisions based on market momentum.
Key Concepts: Overbought and Oversold Levels
Overbought
An RSI value above 70 signals that the asset might be overbought. This condition implies that the asset’s price has increased significantly due to heavy buying pressure and may be higher than its true value. Such situations often lead to a price correction, bringing the price back to more reasonable levels.
Oversold
An RSI value below 30 indicates that the asset might be oversold. This scenario suggests that the asset has been subject to intense selling pressure, causing its price to drop below its intrinsic value. Consequently, the price is likely to rise as it corrects to reflect its actual worth.
RSI Divergence: What It Tells Us
RSI divergence occurs when the movement of an asset’s price and the RSI trend in opposite directions. There are two types of divergence:
Bullish Divergence
Bullish divergence happens when the asset’s price hits a new low while the RSI hits a higher low. This indicates a weakening downward momentum, hinting at a potential upward price reversal.
Bearish Divergence
Bearish divergence occurs when the asset’s price reaches a new high while the RSI forms a lower high. This suggests a diminishing upward momentum, signaling a potential downward price reversal.
Practical Applications of RSI
Identifying Trends
RSI can confirm the strength of a trend. Consistent RSI values above 50 during an uptrend affirm the strength of the upward movement. Conversely, RSI values below 50 during a downtrend confirm the strength of the downward movement.
Spotting Reversals
By keeping an eye on RSI for values above 70 or below 30, traders can foresee potential market reversals. This insight allows for timely entry or exit points, enhancing profit potential and minimizing risks.
Timing Entries and Exits
RSI aids traders in identifying the best times to enter or exit trades. For instance, if RSI falls below 30, the trader might consider buying the asset, anticipating a rebound. Conversely, if RSI exceeds 70, the trader might consider selling the asset, anticipating a pullback.
Conclusion
The Relative Strength Index (RSI) is a vital tool for traders aiming to assess market momentum and make informed trading decisions. By correctly interpreting RSI signals and integrating RSI with other analytical tools, traders can refine their strategies and improve trading outcomes. RSI’s adaptability and reliability make it a must-have in any trader’s toolkit.

