For traders to make consistent profits in the markets, they need to understand how to identify and trade around underlying trends. Trends are often referred to as your friend, “trading with the trend,” and “don’t fight the tape.”
But how long do trends last? What are the signs that you should exit a trade? How exactly does a short-term trader work? In this section, we explore trading time frames in more detail.

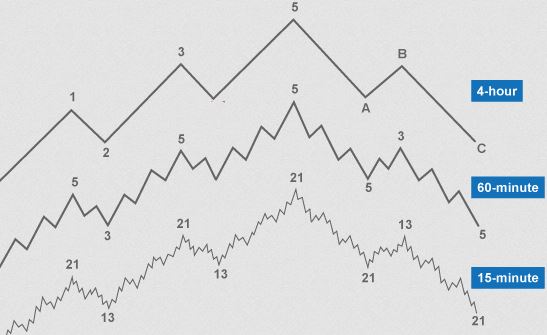
Time frame
There are three types of trends: primary, intermediate, and short-term. There are several time frames in which markets operate simultaneously, however. Because of this, a particular stock can exhibit conflicting trends depending on the time frame.
It is not unusual for a stock to be in an uptrend and mired simultaneously in an intermediate and short-term downtrend.
The more powerful primary trend goes unnoticed by novice and beginning traders, who focus on a specific timeframe. Alternatively, traders may overestimate how important it is to refine their entry in a short-term time frame when trading a primary trend. Find out what time frame is best for trading in this article.
What is multiple time frame analysis?
An analysis of multiple time frames for a single currency pair is known as multiple time frame analysis. The top-down approach is best for this analysis since you start with a broader view and work your way down to see a timeframe to enter a trade.
An ideal trading opportunity is identified by a lower time frame, while a higher time frame identifies a longer-term trend. Consequently, if the higher time frame shows a strong trend, trading it on the lower time frame will likely produce a greater chance of winning.
What time frames should you be tracking?
The general rule is that signals are more reliable if the time frame is longer. The charts become more cluttered with noise and false moves as you drill down in time frames. When trading, traders should aim to identify the primary trend over a longer time frame.
Traders can utilize their preferred timeframe to define intermediate trends and a faster timeframe to define short-term trends after defining the underlying trend. Multi-timeframe analysis can take place using the following examples:
When swing traders use daily charts to make their decisions, weekly charts tend to identify the primary trend, while 60-minute charts help to identify the short-term trend.
In day trading, a trader might use 15-minute charts to determine the short-term trend, 60-minute charts to determine the primary trend, and 5-minute charts (or even tick charts) to determine the long-term trend.
Long-term position traders could use weekly charts to define primary trends while using monthly charts to refine entries and exits.
It is up to each trader to determine what time frame group to use. As a rule of thumb, traders choose the main time frame they are interested in and then choose time frames above and below as complements.
The long-term chart would serve as a trend indicator, the intermediate-term chart for trading signals, and the short-term chart for entering and exiting. However, it is important not to lose perspective and overanalyze a short-term chart. Charts over the short term usually confirm or dispel hypotheses from the primary chart.

Bottom line
Traders can identify and use time frames to identify and follow trends in a market. In the primary timeframe, high-frequency and day traders can take action. There are other time frames you should consider, which may confirm or refute a pattern or indicate parallel or contradictory trends. These time frames can include minutes, hours, days, and weeks.

