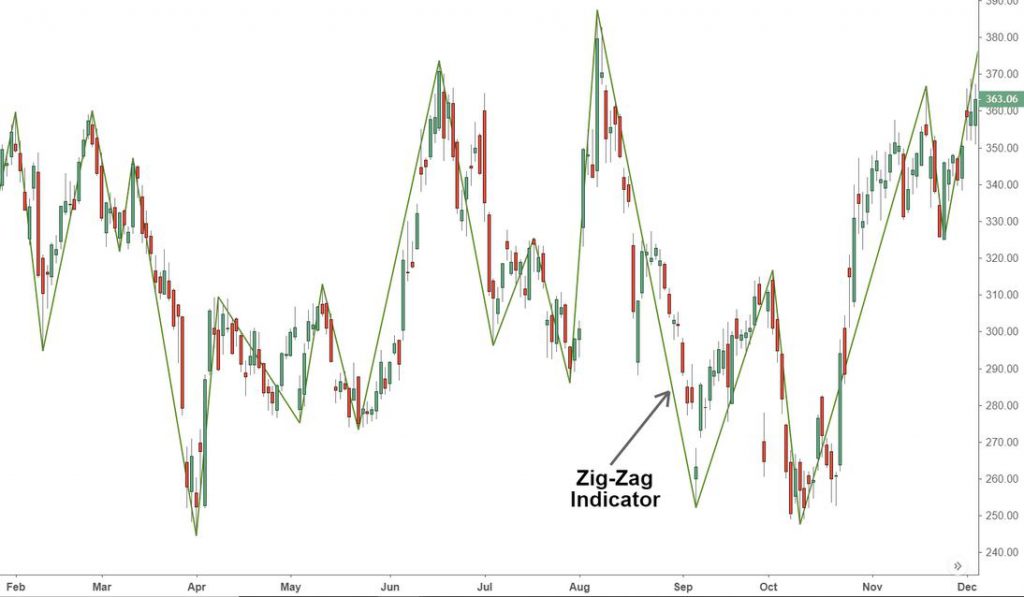
A Zig Zag indicator is a simple tool that traders may use to determine the possibility of a trend reversal in an asset.
Whether used with simple support and resistance analysis, it aids in determining when a market is aggressively reversing the trend or slicing through one of the previously defined levels.
Reading Zig Zag indicators
It is simple to interpret the Zig Zag indicator. First, it merely depicts the trend’s direction; thus, if it increases from the lower left to the higher right and therefore grows in price, it indicates that the market is in an uptrend.
On the other hand, if the Zig Zag indicator falls from the upper left to the lower right, it indicates that the trend is negative.
Setting Zig Zag indicator parameters
In terms of configuration, the Zig Zag indicator is rather straightforward.
There are only three factors, or rather three settings, to consider. Despite having just three parameters, the Zig Zag indicator may be adjusted to suit changing market circumstances.
The depth, deviation, and backstep are generally the default parameters. The default numbers for the three are 12, 5, and 3. These figures, like other indicators, may be adjusted to fit your trading style. The figures are also expressed as percentages.
What do these numbers mean?
The deviation is the smallest number of points reported as a percentage between the highs and lows of adjacent candlesticks. This implies that price changes of less than 5% are disregarded.
The depth is the lowest of the candles on which the Zig Zag will not make the maximum and minimum if the initial number’s requirements are met for the building to take place.
Finally, the backstep is the number of candlesticks that must pass between highs and lows.
Trading with Zig Zag indicator
The Zig Zag indicator may be used in a variety of ways. For example, when the asset is moving in a channel, we prefer to utilize the indicator to discover the buy and sell points. This is performed by first utilizing the indication and then the equidistance tool.
Zig Zag and Elliot Wave
Another method to utilize the zig zag indicator is to pair it with the Elliot Wave. This is a strategy in which the trader examines the five impulse waves and applies them to the market.
Typically, the first wave is a little rally, followed by a slump and then a large rally. Following the surge, there is a tiny fall and another short rally. While seeing these motions is simple, the Zig Zag indicator can assist you in identifying them more quickly, as illustrated below.
The Zig Zag indicator is frequently used with other tools such as the Fibonacci retracement and Andrews Pitchfork.
Bottom Line
The zigzag is an indicator that many people are unaware of. Nonetheless, it is an indication that may be beneficial to you as a trader. You simply need to learn more about it and put it into practice.


