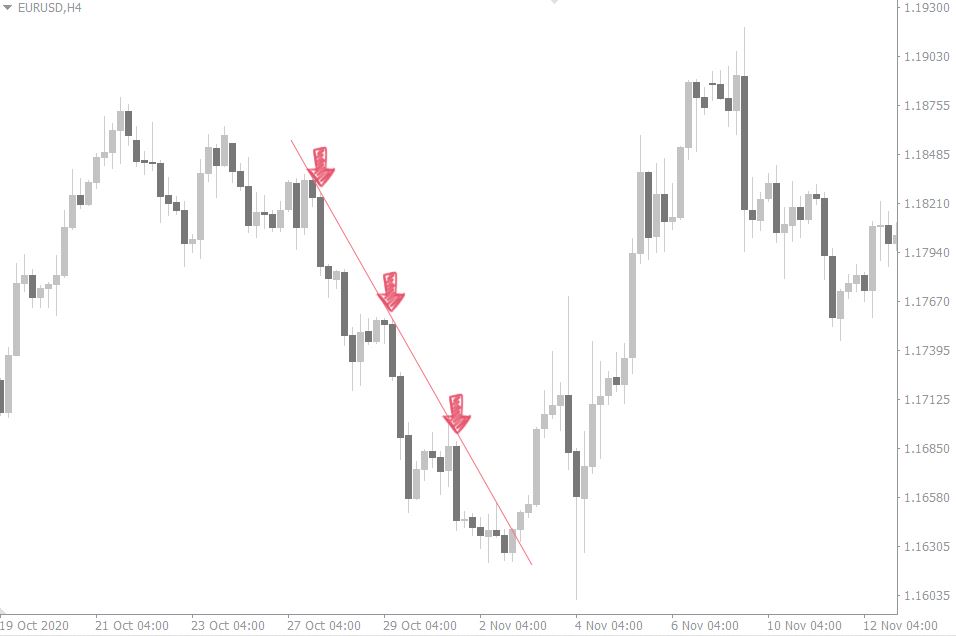
Pullback trading is a popular strategy among traders. It’s hardly surprising because monitoring for pullbacks guarantees that you’re in sync with the market. Moving averages are, without a doubt, among the most prominent tools in technical analysis. In addition, the market could potentially pull back into moving averages.
What is a pullback?
The phrase “pullback” refers to price drops usually.
Essentially, if you’re looking to trade pullbacks, then in an uptrend, you join the transaction when the market is selling at a lower price. It means you’re buying low and selling high.
Pullback using a Moving Averages
For a minimalist trader, moving averages provide a high return on investment.
A moving average is simple to grasp and may be used for various reasons by traders. First, a moving average helps detect trends.
As a result, moving averages are frequently used in simple pullback trading methods. Using a moving average method, I will show you how to go long on a pullback.
The 200-day simple moving average
This is a moving average over a lengthy period. Its significance is found in the broad description of a scenario. Large money managers mainly use this technical value in their investment selections. Because these money managers move a large quantity of money, their activities can significantly impact the price of individual pairs.
Many large money managers sell equities when they fall below the 200-day moving average. Therefore, you may expect the selling to pick up after the price drops below this long-term moving average.
For forex traders, the idea is that anything below the 200-day moving average is a better negative opportunity. Conversely, bullish possibilities have a higher price than the 200-day moving average.
The 50-day moving average
A 50-day moving average is an excellent tool for swing and position traders. In addition, this is a popular technical indicator among significant funds that manage large sums.
The primary purpose of this indicator is that it serves as a support level. You can use a great deal of success in any of your technically based pullback strategies.
If the price pullback stops near this level and the price creates reversal candlesticks, you can think about possible new trade. The above-average volume levels are an additional hint in such a situation.
Forex traders hold positions based on the 50-day moving averages for several weeks, sometimes months.
The 20-day simple moving average
The 20-day moving average is similar to the 50-day moving average discussed above. The distinction lies in the significance of such a pricing level. The 20-day satisfying average price level is sometimes weaker than the 50-day moving average price level.
Trades based on this moving average are similarly shorter in duration. They usually only last a few days, perhaps a week or two. Short-term swing traders commonly employ this indicator. They utilize them as moving support, similar to the 50-day MA, and look for signs for new trading entry.
Bottom Line
Choose the appropriate moving average for your needs.
A moving average is an essential yet effective technical tool for pullbacks. Every trader or investor may benefit from the 200-day moving average. You may also utilize different averages if they match your trading approach.


