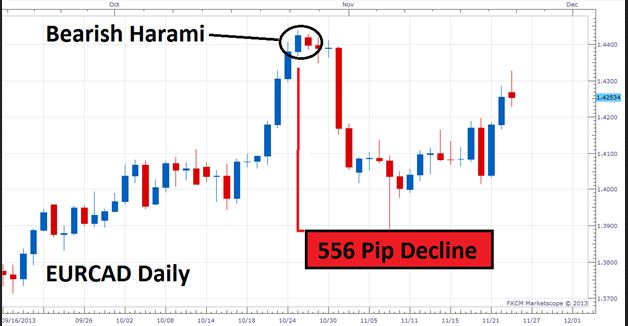
Forex traders frequently use Harami candlestick patterns to identify reversal or extensions of the trend lines. The Harami candles provide traders with valuable indicators in technical trading, making this pattern indispensable. In this article, we will cover the following principal themes about the Harami candlestick pattern in forex:
How do Harami candlesticks work?
Known as the Japanese candlestick pattern Harami, this pattern comprises two candles and indicates a future market reversal or continuation. As a result, the phrase “Harami” derives from the Japanese word for “pregnant,” a symbol for the Harami candlestick pattern.
Bullish Harami:
1. Downtrend confirmed
2. The larger bearish candle (red) leads the way
3. Trailing smaller bullish candle (green) – price gaps up after prior bearish candle and closes entirely within the previous bearish candle’s open and close.
Bearish Harami:
1. Uptrend confirmed
2. A larger bullish candle (green) leads the way
3. Following a leading bullish candle, a smaller red candle trails behind it, showing a price gap down. These two lines are contained in the ultimate bullish candle’s open and close.
The first candle (pregnant candle) stays larger in keeping with the immediate trend. In the trailing candle, the candle protrudes like a pregnant woman. As far as technicals are concerned, the second candle will gap within the first candle because the FX market is open 24/5; gapping on the chart is rare.
The technically correct version of the Harami, which has minimal gaps, can be challenging to find because the second candle is often an inside bar of the first.
By using the confirming candle, traders know whether or not a smaller trailing candle will bring about a reversal or continue following the initial trend.
Harami patterns are popular because they allow traders to catch a reversal at just the right time while maintaining a tight risk profile. Traders can benefit from very favorable risk-reward ratios this way.
Advantages of the Harami pattern
- – Easily identifiable
- – Risk-reward ratios are high, with opportunities to profit from large movements.
- – Used extensively in forex trading
Limitations of the Harami pattern
- – Before execution, confirmation is required
Trading with the Harami candle pattern
Depending on the candle that validates the pattern, Harami candlestick patterns may display bullish or bearish signals. Both types of Harami patterns can be seen on the FX charts and their operation in foreign exchange markets.
Traders can support candlestick patterns with other technical indicators when they use candlestick patterns.
As a result of the Bullish Harami, the currency pair is positioned to continue its current upward trend. Harami patterns do not always imply reversals, and it is essential to remember that. The probability of a reversal signal is often higher at significant price levels, including support, resistance, highs, and lows.
Bottom line
Trading the Harami candles requires an understanding of context. The trader can gain greater insight and forecast Harami’s implications by analyzing past chart patterns (trends) and price action. It isn’t significant to observe Harami without understanding its context.


