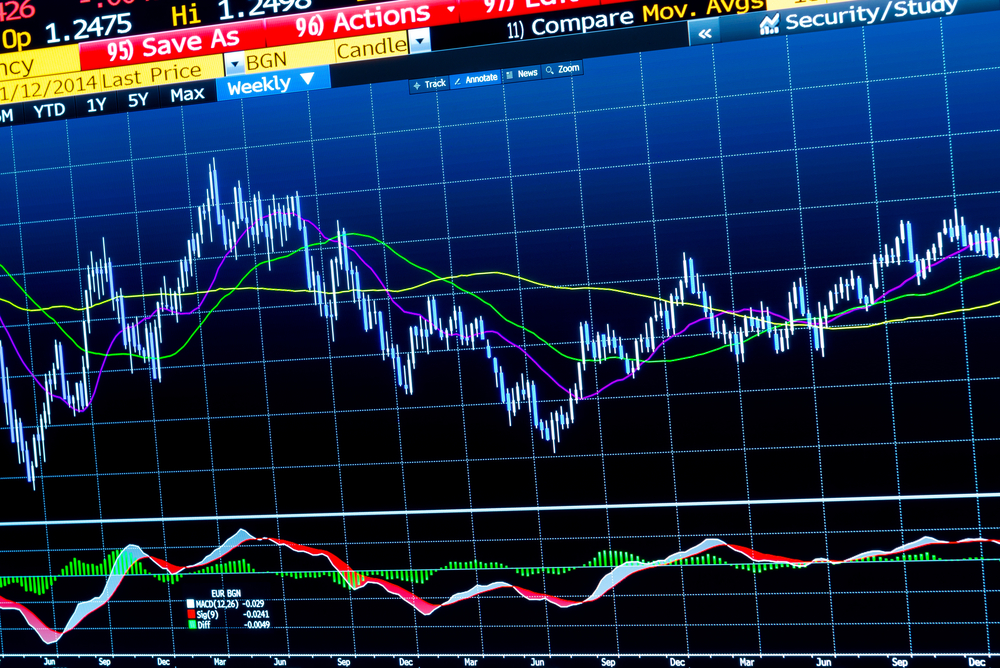
In part one, of this two article series, we discussed how to begin getting ourselves set up to test a trading strategy. We’ve identified the four key groups of technical indicators we’re going to use; a trend following tool, a trend confirmation tool, an overbought/oversold tool and a profit taking tool.
Then we drilled down to discuss the possible specific indicators we might use from each of the technical indicator groups; a moving average crossover, the MACD, the RSI and Bollinger Bands. The moving average crossover will allow us to follow a trend, the MACD should deliver confirmation of the trend, the RSI should illustrate oversold or overbought conditions and using the Bollinger Bands can allow us to identify times when it’s appropriate to take our profits, or alternatively exit a trade at a loss, commensurate with the risk parameters built into our trading plan.
For the purpose of this exercise we’ll omit advising on where we should be placing a stop, as we’ll leave that to our traders’ discretion. It should also be noted that many experienced traders and analysts might suggest that using a moving average cross over and MACD is duplication, they’d also suggest that using four technical indicators is excessive. However, using two sets of moving averages is acceptable, as you’re reconfirming a trend – you’re using the standard MACD setting and using different settings on your separate, two moving average crossover bespoke indicator; one fast moving and one slow moving.
With regards to using too many technical indicators, using four, one from each key set, is certainly not excessive, in many ways it’s an acceptable practice. Many of us will have seen charts littered with just about every indicator on it, combined with trend lines, channels, pennants, flags drawn on, the Fibonacci tool placed on it, etc. Charts so confusing and cluttered they’re impossible to interpret.
Our four indicator model provides a perfect balance and uncomplicated introduction into a multi indicator trading strategy, which may become a template for an individual trader’s long term trading methods.
For ease of explanation and demonstration purposes, we’d suggest using a daily time frame/chart. And we’d also suggest using the most liquid, most traded and as a consequence the major currency pair with consistently the best spreads; EUR/USD.
The moving average convergence divergence (MACD) is a trend-following momentum indicator which reveals the relationship between two moving averages of prices. The MACD is calculated by subtracting the 26 day exponential moving average (EMA) from the 12 day EMA. A 9 day EMA of the MACD, referred to as a signal line is then plotted on top of the MACD, providing in theory a trigger as a buy and or sell sign. Therefore we’ll use different parameters for our separate, bespoke moving average crossover. Perhaps a 14 day period, crossing over a 30 day period combination.
Then we add our RSI, left on its standard setting of a 14 day period, and critically we’re looking for the settings of 70 as an overbought level and 30 as an oversold level, to be marked on the chart. We could also possibly decide to make a decision to enter the market if a reading of 50 is breached to the upside, or to the downside.
We also monitor the Bollinger bands, left on the standard setting. Should the upper band be breached we may consider closing our trade, if the lower band is breached likewise. Alternatively we might consider that the upper and lower bands represent an entry opportunity.
This trading idea only represents one simple method to potentially trade the market. As the title of this two part article indicates, it’s a suggestion to begin experimentation. Naturally, we’d only consider taking a trade/putting an order into the market, or making an overall trading decision, if all the technical indicator parameters converge.
Our challenge is now to test this brief theory out, by using our visual skills, quite simply; if we place those four technical indicators onto our daily time frame, does it work? It being a trigger to enter the market. When all four indicators combine, can we see the potential for profit on the chart? If so how many times? If we absolutely and rigidly stuck to the template was the method successful, perhaps 60-70% of the time? If so then we may be in with a chance of building a highly successful strategy. Our next stage is to historically backtest the method and forward test (in live market conditions), these are subjects we’ve covered before and our clients can access our library of articles for more information.


