Triple Top is a price action pattern that predicts the reversal of the bullish trend. The pattern is represented as three consecutive highs of equal height. It is a special type of Head and Shoulders pattern where the head is placed at levels with the shoulders. Both of them signal a change from an uptrend to a downtrend.
What is the Triple Top Pattern?
We call the pattern reliable for a good reason. As the name suggests, the pattern tells that a price failed to break the resistance level three times consecutively. The pattern is considered void if the previous is breached by more than 5 pips because it shows the potential of rise beyond the previous tops.
Every fresh attempt reinforces that the bulls are losing their grip and increases the chances of a reversal.
How to Identify the Triple Top Pattern?
It is difficult to identify the Triple Top pattern; however, taking a few important factors such as trading volume, price levels etc., into account, it can be made possible.
- You will see a strong long-term uptrend before the Triple Top.
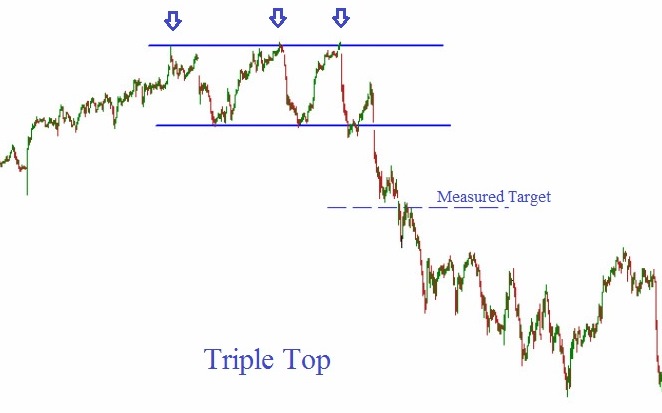
- Three consecutive highs occurring at almost the same level will be visible.
- The lower support lines go through, the lower one of the two lows after the first two highs.
- While the Triple Top forms, the overall trading volume keeps falling. This indicates that the bullish pressure is gradually fading, and a trend reversal is about to emerge.
- The final verification is when a price breaks the lower support level after the third peak has appeared. The breakout is accompanied by a rise in trading volume and price gaps. Post breakout, the support level becomes a new resistance level.
- Measure the distance between the lower support level and the highest of the three highs. Now deduct this value from the breakout level to determine a price target.
- Make sure that the risk (stop-loss) should be at least half the reward (take profit). If you don’t find such an ideal risk to reward ratio, you should skip the signal and stay out of trading.
- The reliability of the Triple Top Pattern depends on the time it took to form. For best results, the pattern should take several months to form.
Bottom line
The triple top pattern is hard to recognize since it requires an in-depth analysis. Differentiating this pattern from the rest can be difficult because the pattern looks exactly like Double Top until the third peak appears.
Moreover, three consecutive highs at the same level are a feature of Ascending Triangle and Ascending Rectangle. Triple Top is verified when an asset falls below the support level, followed by a considerable rise in the trading volume. It means that you should not trade the pattern with a pending sell order near the tops. Rather, it is advised to wait until the pattern is complete and is confirmed by the breakout of neckline support.

