Drawing perfect trendlines can seem like a daunting task, but it’s an essential skill for anyone looking to delve into the world of trading. Whether you’re a seasoned trader or a beginner, mastering trendlines can significantly enhance your ability to interpret market trends and make informed trading decisions. In this article, we’ll explore practical tips and tricks to help you draw accurate trendlines and use them effectively in your analysis.
Introduction
Have you ever wondered how successful traders identify market trends so accurately? The secret often lies in a simple yet powerful tool: trendlines. In this guide, we’ll demystify trendlines, offering you easy-to-follow tips and tricks to draw them perfectly. By the end, you’ll be able to enhance your trading analysis and make more informed decisions.
What Are Trendlines?
Trendlines are straight lines drawn on a chart that connect specific price points, typically peaks (highs) or troughs (lows). These lines help traders visualize the direction and strength of a market trend. Think of trendlines as the skeleton that supports the body of market analysis, providing structure and clarity.

The Importance of Trendlines
Why are trendlines so crucial in trading? They help traders:
- Identify Market Trends: Trendlines reveal whether the market is in an uptrend, downtrend, or moving sideways.
- Spot Potential Reversal Points: When a trendline is breached, it can indicate a possible change in the trend direction.
- Support and Resistance: Trendlines act as support in uptrends and resistance in downtrends, guiding traders on where to enter or exit trades.
Types of Trendlines
There are three main types of trendlines:
- Uptrend Lines: Drawn by connecting a series of higher lows.
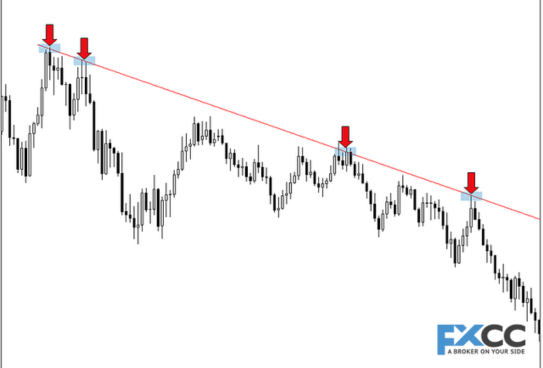
- Downtrend Lines: Drawn by connecting a series of lower highs.
- Horizontal Trendlines: Drawn to indicate periods of sideways movement, connecting highs or lows at the same price level.
Tools You Need
To draw perfect trendlines, you’ll need:
- Charting Software: Most trading platforms come with built-in charting tools.
- A Reliable Data Source: Ensure your data is up-to-date for accurate trendline drawing.
- A Steady Hand and Keen Eye: Precision is key when drawing trendlines manually.
Steps to Draw a Perfect Trendline
Drawing a perfect trendline involves a few straightforward steps:
- Identify the Trend: Look at the overall direction of the market.
- Choose the Right Points: Select the key highs and lows to connect.
- Draw the Line: Use your charting tool to draw a straight line connecting these points.
- Adjust for Accuracy: Ensure the line touches as many points as possible without cutting through the price.
Detailed Steps
- Identify the Trend: Is the market moving up, down, or sideways? Recognize this by observing the general direction of the price movement.
- Select Points: In an uptrend, connect the lowest points (higher lows). In a downtrend, connect the highest points (lower highs).
- Draw the Line: Use the trendline tool in your charting software to draw a line through these points.
- Adjust the Line: Make sure the trendline touches multiple points. The more it touches, the more reliable it is.
Common Mistakes to Avoid
Avoid these common mistakes when drawing trendlines:
- Forcing the Line: Don’t manipulate the trendline to fit your bias.
- Ignoring Time Frames: Ensure you’re using the correct time frame for your analysis.
- Overcomplicating: Keep it simple. Too many lines can lead to confusion.
How to Use Trendlines in Analysis
Once you’ve drawn your trendlines, here’s how you can use them:
- Identify Entry and Exit Points: Use trendlines to determine when to buy or sell.
- Confirm Trends: Trendlines help confirm the trend direction and its strength.
- Spot Breakouts: A break above or below a trendline can signal a potential breakout, leading to significant price movements.
Trendlines and Market Psychology
Trendlines are not just technical tools; they also reflect market psychology. When prices approach a trendline, traders’ collective actions (buying or selling) reinforce these lines, creating self-fulfilling prophecies.
Trendlines in Different Markets
Trendlines work across various markets:
- Stocks: Used to track individual stock performance.
- Forex: Applied to currency pairs to identify trends.
- Commodities: Help in tracking commodity prices like gold or oil.
Advanced Techniques
For experienced traders, advanced techniques include:
- Using Multiple Time Frames: Analyze trendlines in different time frames to get a comprehensive view.
- Combining with Other Indicators: Use trendlines alongside other indicators like moving averages for better analysis.
Trendline Breakouts
A trendline breakout occurs when the price moves through and beyond a trendline, suggesting a possible trend reversal or acceleration. To trade breakouts:
- Confirm the Breakout: Ensure the breakout is significant, not just a minor breach.
- Volume Analysis: Higher trading volume during the breakout confirms its validity.
The Future of Trendlines
As technology evolves, so do trendline drawing tools. Future advancements may include AI-powered tools that automatically draw and adjust trendlines based on real-time data, making the process even more accurate and efficient.

Conclusion
Drawing perfect trendlines is both an art and a science. By following the tips and tricks outlined in this guide, you can enhance your trading analysis and make more informed decisions. Remember, practice makes perfect, so keep drawing those lines and refining your skills.

