
Ahh, the good ‘old Japanese candlesticks. They are the most popular form of charting.
Invented in the 17th century by the Japanese rice merchant Munehisa Homma to conveniently display the beginning (opening price), and the end of the price (closing price) for a certain time period.
The technique of presenting the price in the form of Japanese candles is still in demand today and is now widely used in the forex market’s technical analysis.
How Does Japanese Candlesticks work in Forex?
Ok, let’s get the math stuff out of the way first. The candlestick chart is built in a system of two coordinates. The time is plotted on the horizontal axis, and the price is plotted on the vertical axis.
Now let’s come to the main part.
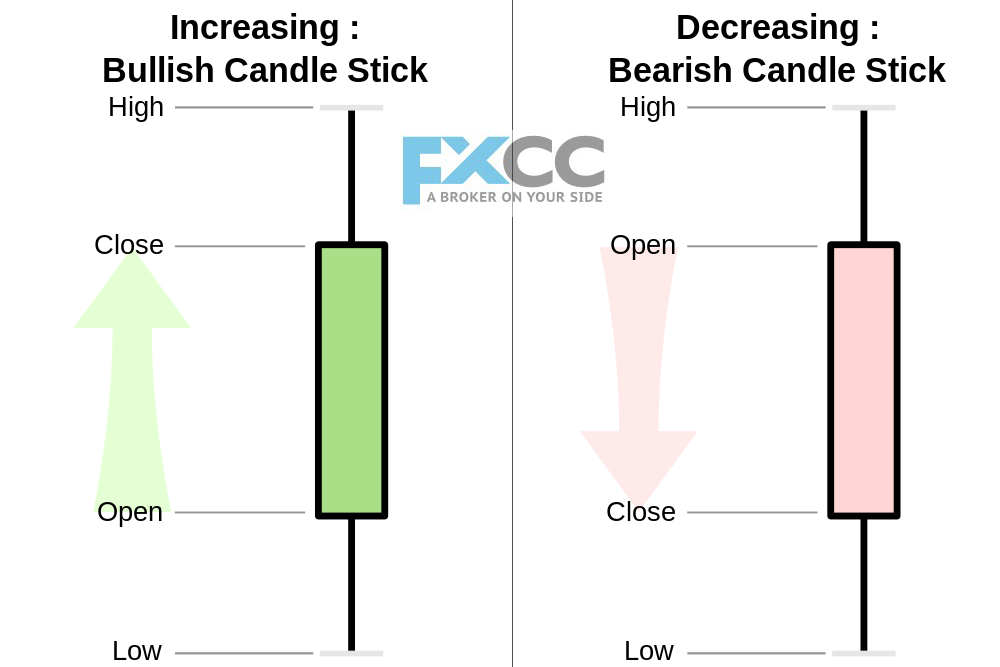
A candle (candlestick) displays the range of the exchange rate for a single period (minute, hour, day, week, etc.) in the form of four fundamental price values for a given period. The lower and upper horizontal lines are the opening and closing prices. The top of the candle is the maximum price, and the candle’s bottom is the minimum price.

A candle (candlestick) displays the range of the exchange rate for a single period (minute, hour, day, week, etc.) in the form of four fundamental price values for a given period. The lower and upper horizontal lines are the opening and closing prices. The top of the candle is the maximum price, and the candle’s bottom is the minimum price.
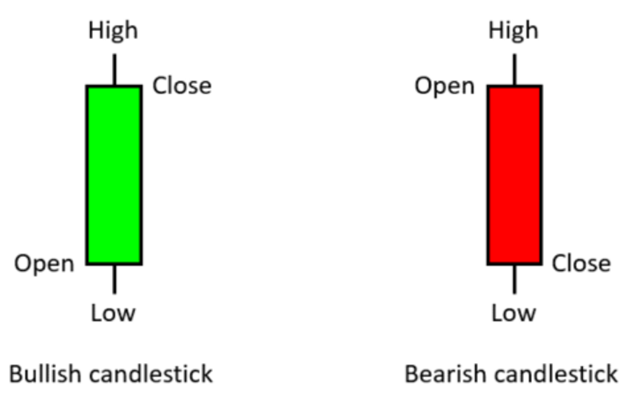
The range between the opening and closing prices is shown as a rectangle, and this is the body candle. If opening and closing prices are equal, then the candle body degenerates into a horizontal stroke and the candle itself into a cross.
If a closing price is higher than the opening price (bullish market), then the candle body is usually drawn green. If a closing price is lower than the opening price (bearish market), then the candle body is drawn red.
Vertical segments above and below the body of the candle are called shadow (wick).
In the original Japanese charts, the rising market was indicated by a red candle and the falling one by a black one. Modern technical analysis programs allow you to set candles to any color.
A sequence of candlesticks forms a candlestick chart.
The candlestick chart displays gaps and allows you to assess the market trend for each trading period visually.
Various lines (trend, support, and resistance) and technical indicators can bedrawn on Japanese candles.
Types of Japanese Candles
- Bearish candles
- Bullish candles
- Doji (opening and closing prices equal)
All other candles are a modification of these due to size of bodies and shadows. Individual candles or combinations may indicate a change or continuation of the trend.

Key takeaways from candlestick analysis
- Body – The longer the body, the stronger the market’s potential to go in the upward direction: for the white candle – up, for the black – down.
- The shadows – The longer the shadow on either side, the weaker the market potential. For example, a long upper shadow indicates the inability of buyers to gain a foothold on the top.
- Negation – If the market has not gone in the expected direction, then it is more likely to move in the opposite direction. Here it would be best if you wait for the confirmation candle.
With prolonged speculation in the market, you can easily recognize a particular situation on the chart with the help of Japanese candles. If you would like to know more about all other types of Forex charts, read FXCC’s most comprehensive article on How to read Forex Charts.

