This article explains everything traders need to know about harmonic trading patterns, how they can be used in currency markets, and market harmonics and harmonic ratios.
Harmonic Trading has its roots in the Gartley pattern. The Gartley pattern’s 222 comes from H.M. Gartley’s book “Profits in the Stock Market”.

Gartley patterns: what are they?
In a Gartley pattern, the price moves in a trend but begins to show signs of correction after moving in a trend for some time.
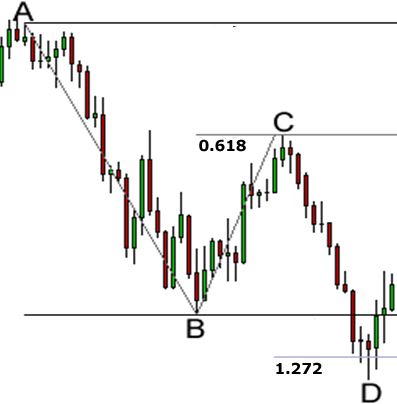
Gartley patterns should look like this:
- A retracement of .618 should be used to move AB
- The move BC should be either a .382 or a .886 retracement of the move AB
- Considering that move, BC retraced .382 of move AB; CD should be 1.272
- As a result, if move BC extends 1.618 from move AB, then move CD should also extend 1.618 from move BC
- The CD should be a retracement of XA in .786
- Trading the Gartley pattern involves buying or selling at point D, depending on the pattern direction.
Harmonics Patterns: Market Harmonics
Over time, traders have created variations of the Gartley pattern, and its popularity has grown. One of the most popular and successful harmonic trading techniques was by Scott M Carney. As a result, they provide us with visual occurrences that tend to repeat themselves repeatedly. Harmonics identifies the market’s rhythm or pulse and utilises its trading opportunities.
As with many other patterns and cycles in life, trading patterns or cycles repeat themselves in this methodology; the key is to identify these patterns and then enter or exit a position based on the probability that the same historic price action will occur again. While these patterns are not 100% accurate, they are historically accurate. Significant opportunities can be identified with minimal risk if they are identified correctly.
How do I identify harmonic trading patterns?
To identify harmonic trading patterns, study price charts and look for relationships between price and Fibonacci ratios. Fibonacci retracement and extension levels are standard tools for this process. Bullish Gartley patterns, for example, form specific ratios between price movements, such as 0.618 or 0.786. These patterns can be automatically identified by software or charting platforms, which traders often use.
What’s the purpose of trading with harmonic patterns?
Harmonic patterns are used as a primary tool for trading to predict potential trend reversals or trend continuations in the market. By analysing these patterns, traders can make informed decisions about entering and exiting positions based on their technical analysis. Harmonic patterns can act as signals to take action, such as placing a buy or sell order, depending on the pattern and market conditions.

Harmonic Trading Patterns and PRZ
Identifying harmonic patterns based on specific price structures and quantifying them with Fibonacci calculations is possible. These patterns are price structures that contain Fibonacci projections and retracements that are distinct and consecutive. Identifying harmonic pattern areas that could hint at price turning points can be accomplished by calculating the Fibonacci aspects of a specific price structure.
A well-defined PRZ usually provides some initial reaction when most harmonic patterns are tested for the first time. Scott M. Carney has identified those reversal spots as the PRZ—the Potential Reversal Zone. A high volatility price can immediately reject the price during the initial test, which can occur quickly.
Bottom line
To make harmonic patterns work for you, you need to apply them alongside other technical and fundamental analysis techniques, and you should consistently implement stop-loss orders and position sizing in your trading strategy to manage risk.

