In search of an algorithm that can give them an edge on the market, traders are always digging through mathematical books. Unsurprisingly, concepts such as chaos theory and fractal geometry are at the core of fractal indicators. An investor must know when the market suddenly changes direction based on fractal signals that calculate irregularity.
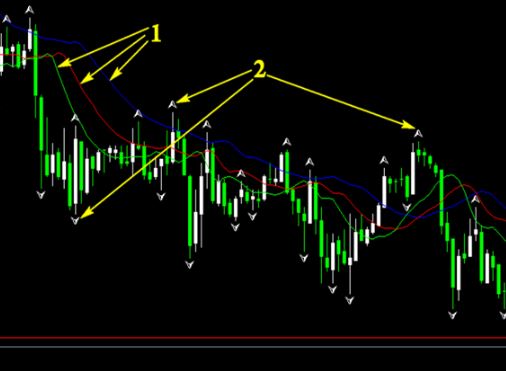
Investors use fractal indicators to spot patterns and decide what to do based on how bullish or bearish the indicator is. When the fractal indicator appears on a chart, over and under candles are shown in geometric forms. In this case, the fractal indicates a bearish trend, and the fractal under it indicates a bullish trend.

Fractal Principles In Technical Analysis
Three principles guide the development of fractal indicators. In the market, energy follows the path with the slightest opposition. The price of a currency pair that is falling often continues to fall until a strong fronting force comes into play. It is always the case that traders will leave a trade when the distress of losing more money outweighs the pressure of losing money.
A second principle is that the fundamental structure of markets leads to the road of most minor opposition resistance. In the end, the unknown composition can be found and changed.
Fractal Pattern Interpretation
There are two types of fractal patterns, V and U, which form at the upper or lower levels of the market. There is rarely a flawless and uniform pattern. It shows when an uptrending market reverses into a downtrend or when a downtrending market reverses into an uptrend.
Fractal patterns tend to identify a short-term level of price support, also referred to as bullish or bearish fractals.
Fractal patterns are not used exclusively by investors but often work with other indicators that signal support and resistance. Pivot points are used by most to assess the strength or potential commitment of the fractal indicator’s trend reversal indicator.
Benefits Of The Fractal Indicator
Fractal indicators offer traders an easy way to identify market entry points and price points for stop-loss orders that are equally easy to spot. The following are some other benefits:
- As soon as you learn how to use it, it can be straightforward to discover alerts and trading signals.
- Using fractals when resolving trends can be a valuable addition for traders.
- This is useful for setting take-profit and stop-loss orders.
- By omitting the highs and lows, the indicators reveal potential resistance and support levels for the buying or selling positions.
- Analyzes potential breakouts.

Conclusion
Trading with fractals offers smooth trading and can be used for automated Forex trading software. They can be valuable tools in any trading strategy. When young traders start their trading careers, they should study technical indicators to learn the nuances. Still, they will become more proficient when fractal indicators are in their trading toolbox. The Fractal indicator is an excellent tool if you’re new to trading Forex.
As a result, you’ll better understand how to improve your trading and be able to seek financial advice from other traders freely. Traders can invest their money in complex instruments to protect their original investment or take a higher risk. In technical analysis, Bill Williams has done a great deal of good. There is no doubt that Williams fractals are not the most popular indicators, but they can be especially helpful in identifying support and resistance levels. It is an excellent technical analysis tool for using fractal patterns daily.

