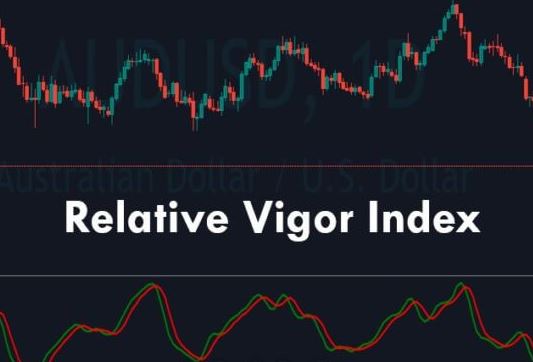
A Relative Vigor Index (RVI) indicates a trend’s strength and confirms overbought, oversold, and divergence signals in forex trading.
We will discuss the Relative Vigor Index in depth in this article.
What is the Relative Vigor Index?
A relative vigor index is a momentum indicator that identifies strengths and weaknesses of current trends by comparing closing prices to trading ranges. It fluctuates around a zero line.

As the upper extreme value approaches +100, traders are encouraged to enter long positions as it indicates maximum bullish momentum.
It indicates maximum bearish momentum, and traders should enter short trades at the lower extreme, around -100.
A rise in the RVI line indicates more bullish momentum than bearish momentum, while a decline in the RVI line indicates more bearish momentum than bullish momentum. The magnitude of the RVI indicates trend strength.
Top RVI trading strategies
1. RVI and RSI
RSI and RVI are complementary indicators to identify confirmed overbought and oversold market conditions and entry and exit points.
RVI and RSI are used as a strategy when trading forex because convergence and divergence are examined. Indicators that move in the same direction indicate a strong trend, so traders should place orders along with it. If, however, the two indicators move oppositely, it indicates that the current trend is weak and trading opportunities will favor a reversal of market momentum.
RVI crossing the RSI line signals traders to place long orders when the RVI line crosses from above
Traders should place short orders when the RVI line crosses the RSI line from below, signalling a stronger bearish trend.
2. RVI and two moving averages
RVI combined with moving averages allows market orders to be placed according to a confirmed trend. Short-term moving averages that are above long-term moving averages, as well as RVI lines crossing the centerline from above, indicate a bullish trend. As a result, traders may be able to place long orders. The RVI line crossing the centerline from below indicates a confirmed bearish trend if the short-term moving average line is below the long-term moving average line. It could indicate potential short-term opportunities.

3. RVI and stochastic oscillator
The RVI and stochastic oscillator are often used together in a trading strategy to confirm potential trading signals generated by each other. In addition to identifying potential market reversals, the stochastic oscillator also confirms the RVI’s trading signals.
You can plot the RVI against the centerline and the stochastic oscillator on a price chart. If the RVI crosses above or below the centerline, the stochastic oscillator will confirm the trend direction. If the %K is above the %D (moving average of %K), traders should enter a long trade to confirm a bullish trend. If the %K line is below the %D line, traders should enter a short trade because a bearish trend has been confirmed.
In addition to identifying market divergences, market practitioners use this strategy regularly. When the RVI makes a high low, but the stochastic oscillator makes a low low, it signals an uptrend reversal and indicates traders should enter a long position.
Bottom Line
The RVI indicator can be combined with other technical analysis tools, including RSI, moving average, and stochastic oscillator, to identify and confirm market signals. Refining trading strategies and placing market orders more effectively by implementing RVI is possible.


