As a trading tool, Forex Heat Map helps traders analyze the market and make informed trading decisions. This article will discuss Forex Heat Map basics, its benefits, and how you can use it to improve your trading performance. It visualizes currency strengths and weaknesses based on the current market conditions and helps traders identify the best trading opportunities.

What is a Forex Heat Map?
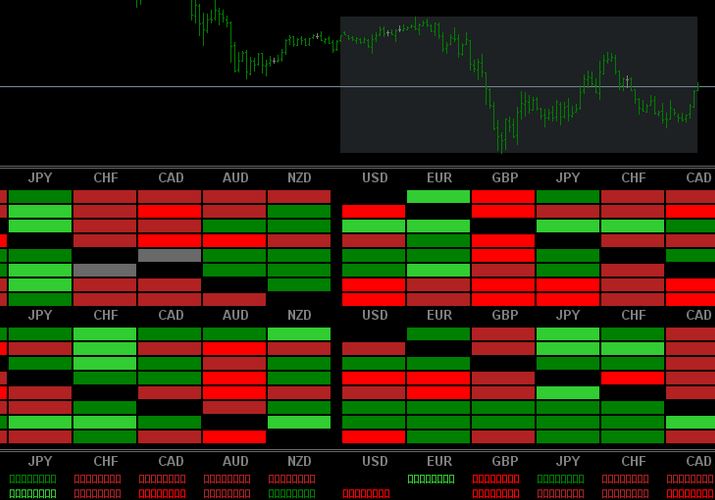
The Forex Heat Map indicates how strong or weak a currency pair is against another currency, based on its strength or weakness. The color of each currency indicates its strength. A bright color represents a strong currency, while a dull color represents a weak currency.
In addition to providing traders with an understanding of market sentiment and currencies’ relative strength, the heat map can be displayed in different time frames, from minutes to weeks, depending on the trader’s preference. For traders who are interested in identifying trading opportunities based on the current market conditions, the Forex Heat Map is a great tool.
How Does a Forex Heat Map Work?
Forex Heat Maps analyze the market and determine each currency’s strength or weakness according to various factors, including economic data, geopolitical events, and market sentiment. Traders can then identify trading opportunities quickly and easily using colors to represent each currency’s strength or weakness.
A heat map shows the USD in vibrant colors when the USD is strong and the EUR in dull colors when the EUR is weak. This information can help traders make informed decisions, such as selling the EUR/USD pair or buying the USD/JPY pair.

Benefits of using a Forex Heat Map
Forex Heat Maps have several benefits, including:
- Heat maps help traders quickly identify current market sentiment and the relative strength of different currencies by clearly understanding the market sentiment.
- Provides traders with an opportunity to identify trading opportunities based on the strengths or weaknesses of different currencies.
- It provides traders with easy-to-understand information, and traders can quickly interpret the heat map.
- Trading on the heat map saves traders time as they don’t have to spend hours analyzing the market to identify potential trades.
- Traders can make better trading decisions by using the heat map. The heat map helps them understand market conditions, reducing the possibility of making a bad decision.
How to use a Forex Heat Map
Here are the steps traders should follow to use a Forex Heat Map:
Choose a time frame: Whether a trader trades short-term or long-term, a time frame should suit their trading style.
Identify the strongest and weakest currencies: By observing the heat map’s colors, traders can determine the strongest and weakest currencies.
Look for trading opportunities: Different currencies may offer trading opportunities depending on their strength or weakness.
Confirm the trading signal: Using other technical analysis tools such as trend lines, resistance, and support levels, and moving averages, traders can confirm the trading signal.
Conclusion
Traders who want to make informed trading decisions should use the Forex Heat Map. By using the heat map, traders can save time and reduce the risk of bad trading decisions by improving their trading performance. In addition to providing traders with an understanding of market sentiment, heat maps can also help traders improve their trading performance when combined with other technical analysis tools.

