All financial markets, including Forex, rely on Bollinger Bands for technical trading. Bollinger Bands are introduced in this article and how the technology is used to assist traders in technical analysis.
Additionally, the article will provide an overview of the best Forex trading strategies and tips, including trading the trend and the Bollinger Squeeze.
What are Bollinger bands, and how do they work?
Trading professionals use Bollinger bands as a versatile, technical analysis indicator. John Bollinger created this indicator to determine highs and lows in market conditions characterized by volatility. The indicator has three main components: an upper, lower, and moving average line.
Normally, two standard deviations above and below the moving average are assigned to each trading band. Thus, according to the two standard deviations, 95% of the price data can be classified into these two bands.
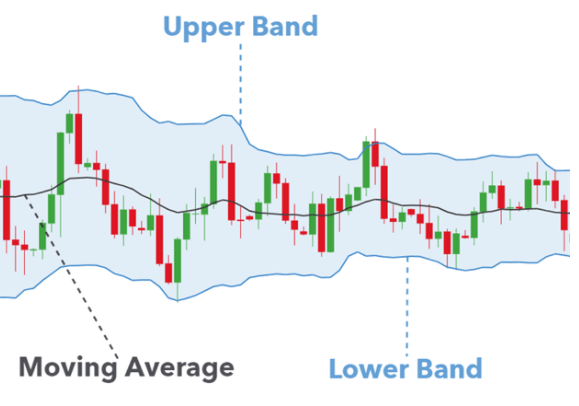
Typically, prices are considered overbought at the upper band and oversold at the lower band when they touch them.
The Bollinger bands become an excellent tool to gauge volatility as price oscillates between the upper and lower extremes of the indicator.
Bands contract during low volatility periods, which makes range-bound strategies highly effective. Furthermore, Bollinger Bands will expand as volatility increases. These are the times when traders tend to use a breakout strategy or a tending strategy.
How to trade Forex with Bollinger Bands?
To trade Forex markets with Bollinger Bands, there are several different techniques. Popular ones include:
- Using market trends: Traders can use market trends to measure support and resistance to identify entry signals.
- Bollinger squeeze: Applying volatility indicators to the band.
Trading the trend
Chart for EUR/USD every week.
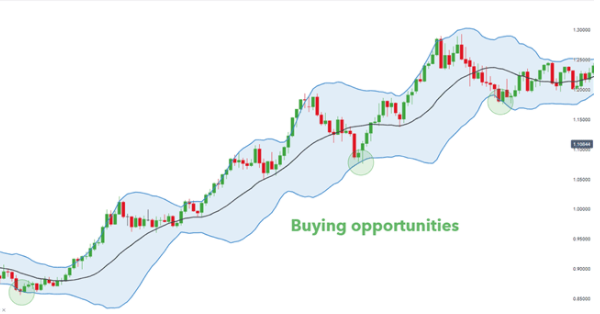
The chart above shows that the EUR/USD price chart shows an uptrend, indicated by rising highs and rising lows. Bollinger Band indexes allow us to identify support levels by observing the lower band. If price hits the lower band, traders use it as a signal to enter long (buy) positions. Thus, it is suitable for both up and downtrends. Depending on the trend, the take profit (limit) levels are normally taken from the upper and lower bands. To determine to take profit, we will use the upper band in this example. To summarize, Bollinger bands are a relatively simple way to trade trends:
- Analyze the trends
- Consider upper and lower bands along with price movement when identifying entry points.
- As the target levels, respectively, use the upper and lower band.
Trading the Bollinger Band squeeze
Chart for EUR/USD at the weekly level:
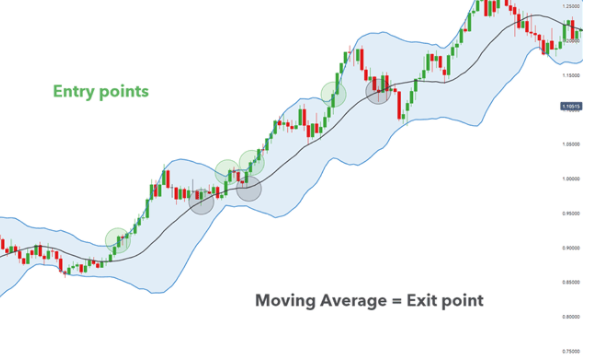
As noted previously, volatility drops when the band contracts and vice versa. Depending on the trend, Bollinger Squeezes look for breakouts above or below the band to serve as entry signals. This breakout is in an uptrend, as shown in green. This is where traders should try to enter. With each entry, it is visible that candles are following the Bollinger Bands (following the upper band). With each breakout candle, the bands widen, suggesting more volatility in the market.
The black shaded circles indicate when traders will consider taking profits before looking for more breakout signals.
Bottom line
You can use the FX Bollinger band trading strategy by using the following tips:
- Search for low volatility (contracting band).
- Be on the lookout for upper/lower band breakout.
As soon as the moving average is reached, close the trade.

