Trading Forex requires proficiency in interpreting and recognizing candlestick charts as a fundamental skill. Patterns such as these provide valuable insights into the minds of market participants and give clues about upcoming price movements. One pattern stands out from the rest because of its message’s strength and distinct appearance – the long-legged doji.
Dojis, with their long shadows and tiny bodies, signify that the market is in a state of equilibrium, where neither buyers nor sellers have a decisive advantage. A pattern like this usually occurs during increased uncertainty, making it an important indicator of potential market turning points.

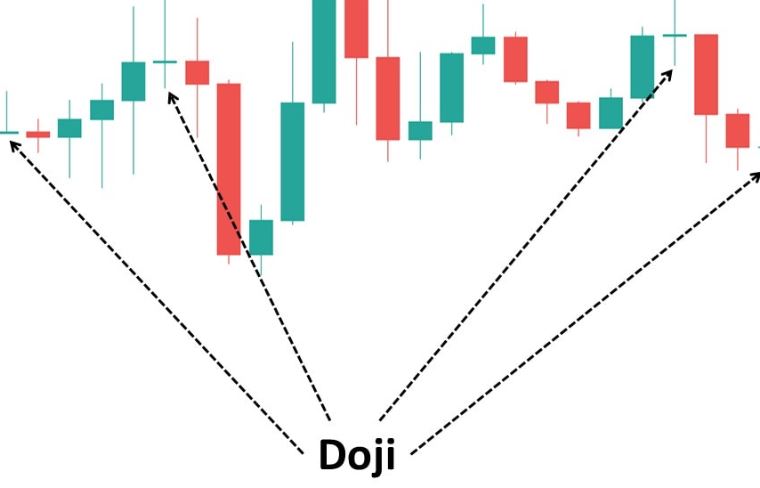
Understanding The Long-Legged Doji Pattern
Long-legged doji candles, which indicate a near balance between supply and demand, form when opening and closing prices are at or near the same price during a trading session. Candlesticks exhibiting this equilibrium have a small body between two long shadows, often compared to a cross or +.
Long-legged candles represent trading ranges during a session as measured by the length of their legs or shadows. If both the upper and lower shadows are long, both bulls and bears were aggressive and active during the session, resulting in significant fluctuations in price. After the session, however, neither group maintained control, and the price closed near the opening.
A long-legged doji indicates solid indecision in the market when it forms. It is clear from the long shadows that buyers and sellers struggled to control the price during the trading period. There is a stalemate between the buyers and the sellers, with neither able to prevail decisively.
The Implications Of A Long-Legged Doji
In the long-legged doji, buying pressure equals selling pressure, and the market ends roughly where it began. The price action ultimately returned to the opening price despite significant price breaks in both directions, indicating a lack of decision-making on the part of the market.
It depends on the market context whether a long-legged doji is bullish or bearish. When analyzing long-legged dojis, consider the current trend and other patterns.
The appearance of a long-legged doji at the peak of a bullish trend can signal a bearish reversal, while the formation of a long-legged doji at the beginning of a downtrend could indicate a bullish reversal.
Long-Legged Doji In Forex Trading
Long-legged dojis are unique in Forex trading due to their potent signal of market uncertainty. As a result of this pattern, forex traders gain a crucial understanding of the psychological state of the participants in the market.

In the Forex market, which is incredibly volatile, long-legged doji patterns are significant, given the rapid price movements. In the forex market, price fluctuations are a common characteristic, as evidenced by the long shadows of the candlesticks.
However, the small candlestick body indicates that despite these fluctuations, the market ended in a stalemate, with close prices on opening and closing days. This pattern often emerges when market participants are uncertain about economic or geopolitical developments. Traders can use long-legged dojis as warning signals to reassess their positions and prepare for potential trend reversals.

