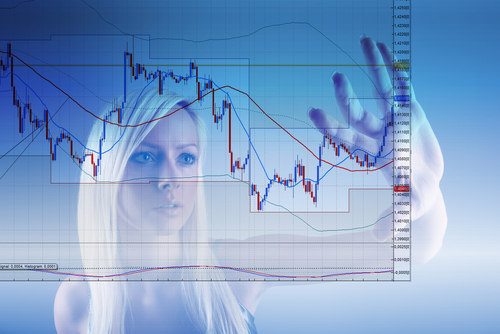
It cannot be denied that broadening one’s knowledge of forex charts is a bit challenging. After all, such graphical representations of data are innately complicated. Furthermore, the sheer abundance of “guides” about charts on the web makes for a confusing learning endeavor. Worry not though, as becoming even more aware of the various facets of such graphical tools need not be a bothersome pursuit. To put it simply, reading this fact-filled article would prove to be an excellent way of learning more about charts. Indeed, anyone who partakes in currency-exchange activities should definitely read on.
Many traders find it surprising that there are variations to the commonly known three kinds of forex charts. Essentially, while beginners are often told that forex trading merely involves the use of line, bar, and candlestick charts, it is undeniable that expert traders continuously benefit from Heikin-Ashi charts. To explain, a Heikin-Ashi graph features interconnected “candlesticks” where each one represents unique data. What makes such a graphical tool so popular among experienced traders, however, is that analyzing volatile currency pairs no longer remains synonymous with hit-and-miss endeavors when relying on it.
It should also be emphasized that there is another interesting alternative to much more common forex charts. To put it simply, the Renko chart is gaining popularity among those who mainly choose to engage in swing trading due to its uniqueness as a “time independent” guide, making it superior to the candlestick. Of course, those relatively new to the world of currency exchange would have one question in mind at this point: what exactly is swing trading? Well, unlike most trades that are completed in the fastest possible manner, swing transactions remain at an “open” position for an extended period, usually longer than an entire day.
While the abovementioned facts about forex charts are certainly intriguing, rest assured that most traders would also be perplexed by the following piece of information: quite a number of people make use of Tick charts. Even though not as popular as the “mainstream” chart variants and not as commonly discussed as the Heikin-Ashi and the Renko, the Tick chart does boast of a useful function. In particular, the Tick chart mainly reflects data about changes in the bidding and asking prices provided by market makers.
Even those who are already proficient in reading line, bar, and candlestick charts still have a long way to go in terms of gaining mastery over all “graphical guides”. To reiterate, such people might still face the need to learn about the Heikin-Ashi chart, especially if they generally focus on volatile currency pairs. As also emphasized, the presence of the Renko chart makes it clear that most traders still have much to learn, particularly those who engage in swing trades. Of course, trying out Tick charts would be beneficial. All in all, there are probably other forex charts to discover.


Comments are closed.