There are two categories of financial market analysis. Among other factors, fundamental analysts consider macroeconomic conditions, earnings, interest rates, and future price movements in predicting price movements, whereas technical analysts think all public information affects price movements.
In technical analysis, candlestick price charts help to predict future price movements based on past price movements. Traders can use the Hanging Man and Hammer patterns to gain insight into the market.

What are their key differences, and what do they mean?
What is a candlestick?
Price charts such as candlesticks are a type of price chart. This is a tool used in technical analysis to display the highs, lows, and openings of currencies in a particular period. A candlestick appears to have been invented by Japanese rice traders and merchants for tracking rice markets. In the US and around the world, it became popular.
Candlesticks have a wide body called the real body. The closing price tells traders whether the opening price is higher or lower than the closing price. In the same way, the colors visible on the chart serve the same purpose. Red or black indicates a lower closing currency, and white or green indicates a higher closing security.
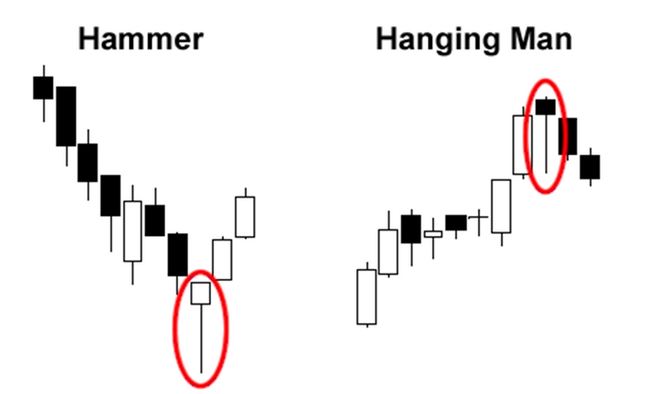
The Hanging Man candle and Hammer candle are similar in appearance. In both patterns, the lower shadows are long, and the bodies are small, but the hammer pattern is bullish. It is the short-term trend that distinguishes the two patterns.
Hammer candlestick
When the trend is at its bottom, a bullish hammer candlestick appears. It consists of a long lower shadow surrounded by a small upper body. The size of the lower shadow can tell traders whether the pattern is bullish or bearish. It is more bullish when the shadow is longer and lower. Hammers should trend downward before this.
When the hammer pattern forms, the prices tend to fall to a new low. When the security sells at those levels, its price rises until it reaches its high point. According to the movement, the buyers prevented the price from falling further and ultimately drove it to its high point.

It is important to remember that prices can continue to move upward after a confirmation candle. Price may spike high if a long-shadowed hammer and confirmation candle is visible. You may want to avoid buying here.
Furthermore, Hammers doesn’t specify a price target. A hammer trade’s reward potential can take time to determine. Candlestick patterns should also be used to determine exit points for traders.
Hanging man
Top reversal patterns such as Hanging Man are top reversal patterns. A market high indicates it. Candlestick patterns that precede an uptrend qualify as hanging men. In a bearish hanging man pattern, high levels of selling pressure are present.
During an uptrend, bulls control the price, and we see highs, but the hanging man pattern indicates that sellers or bears have returned. As a result, the price has fallen to its lowest level due to their attempt to control the trend.
There is a very frequent Hanging Man pattern. Traders can find it difficult to predict price movements if they highlight them on charts. In this case, traders may want to look for more volume, long shadows in the lower part of the chart, and increased volumes. In addition, a stop loss set above the hanging man high can also be a stop loss by traders.
Bottom line
A hanging man pattern and a hammer pattern are candlestick patterns that indicate trend reversals. It is their respective trend that differentiates them. Patterns with rising trends suggest a bearish reversal, such as a hanging man, while patterns with falling trends suggest a bullish reversal, such as a hammer. Otherwise, they are similar.

