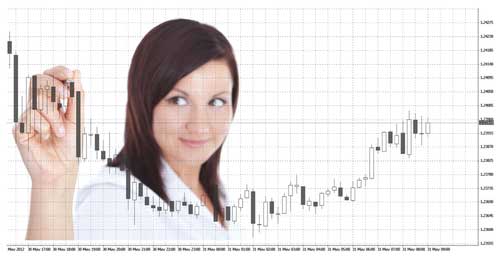
Using Fibonacci retracements has become an important part of creating high probability trading strategies for many traders since they facilitate the identification of resistance and support levels as well as entry and exit points for trades. A retracement represents a short-term price movement within a longer-term trend. It is not the same as a reversal, in which the larger price trend changes direction to start a new trend, although many traders often mix up the two. Forex swing traders use retracements to make short-term profits by scalping, or quickly opening and closing a trade.
How do Fibonacci retracements work in high probability trading strategies? Fibonacci ratios are ones that naturally tend to recur over and over again. The key Fibonacci ratios are 38.2%, 23.6% and 61.8%. One example of how Fibonacci ratios recur can be seen at your fingertips, literally: the ratio of the distance between the tips of your fingers and your wrist is 38.2% that of the distance between your elbow and your fingertips. When applied to the forex markets, currency prices briefly encounter resistance or support at the Fibonacci levels before continuing in the original direction. For example, a currency price on an uptrend might briefly reverse at the 61.8% level before continuing to move upwards.
To determine these levels of support or resistance, start by locating the highest and lowest prices of the chart and then drawing horizontal lines at the Fibonacci ratio levels, i.e. 61.8% followed by 38.2% and 23.6 percent. Following a significant upwards or downwards price movement, the new support or resistance levels are usually at or close to these Fibonacci lines.
One way of using Fibonacci retracements to make high probability trading strategies is to make them entry points for a trade. Once a retracement has occurred at a Fibonacci level, the trader is assured that the price is following the larger trend. And, of course, they can trade the retracements themselves, placing their stop losses just below the level at which the retracement is set to occur.
When creating high probability trading strategies using Fibonacci retracements, however, the wise trader will not rely on this indicator alone but will confirm price movements using other indicators. For example, you can use stochastic oscillators or the MACD to confirm the momentum of a price trend. To illustrate, if you detect a possible retracement, you can use another indicator to confirm the direction of the momentum. Once the direction has been confirmed, the trader can take a long position and make a handsome profit.
Another common mistake made by traders using Fibonacci retracements is to mix up reference points. For example, when using a candlestick chart, the trader might move from applying the price charted on a candle ‘wick’ to one that is charted within the body of the candle, which will not provide accurate results. The trader should keep their usage of reference points consistent so that they can detect support and resistance levels more accurately and make analysis of the charts quicker.


Comments are closed.