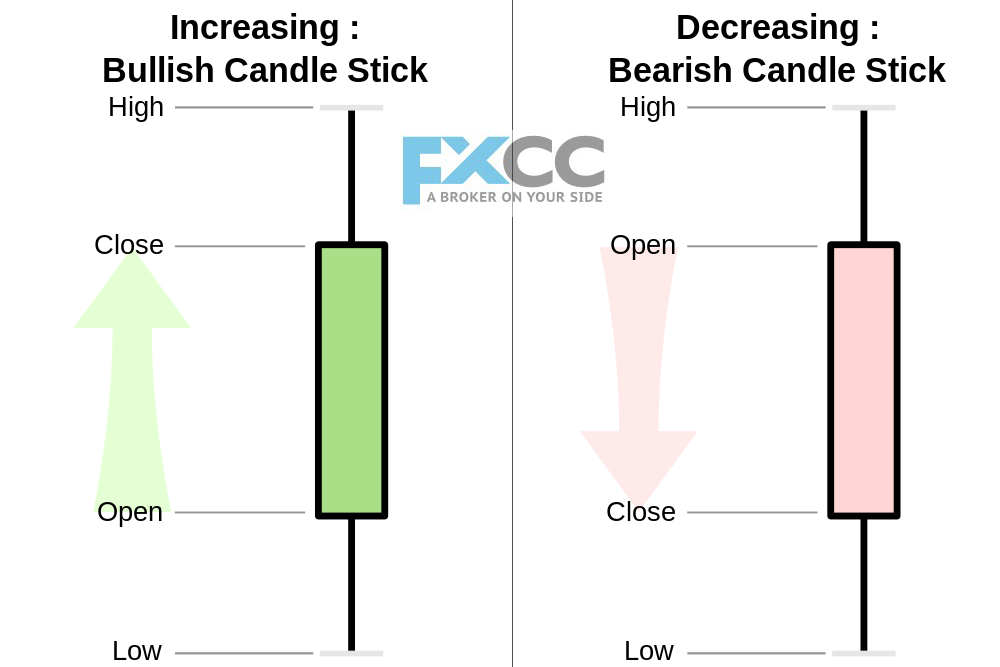
Candlesticks and price action are two powerful trading concepts, and some candlestick patterns have been found to have high predictive value and could produce positive returns.
The Candlestick chart is used as a basis for Technical analysis of stocks, currency, and forex trading. Candlesticks provide insight into the market’s next course of action. By looking at their structures (body and shadows), you’ll be able to determine whether you should maintain a bullish bias or a bearish bias for the upcoming few sessions.
Candlesticks form patterns that give you an idea of whether markets are controlled by buyers or sellers based on their patterns.
Why are candlestick charts essential to learn?
The stock price movement can be predicted by determining the price action and using these methods. Understanding different strategies can help you become a more successful trader.
A candlestick chart is easy to read, provides more details about the market at a glance than bar charts or line charts, and is simple to analyze.
Traders can choose whether the market is strengthening (becoming bullish) or weakening (becoming bearish) by merely examining the color and length of a candlestick. Seeing how the market moves are more manageable this way.
Candlestick charts can be a powerful tool for amateur or aspiring traders for technical analysis. Many successful traders choose technical chart analysis as their go-to tool when day trading or swing trading.
Technical charts alone are not sufficient for investing. Investing successfully involves a technical and fundamental approach backed by research. Before analyzing a stock’s technical chart for investment purposes, one must analyze its fundamentals.
A technical analyst who has a severe interest in the field will study and experiment with everything they encounter.
Is it essential to trade candlesticks?
Possibly. Maybe not. Price, volume, and time are all part of technical analysis. Candlesticks are necessary for achieving this goal if they assist you in doing so. Don’t think they will unlock the market with some mystical power.
According to a common misconception, Japanese candlestick charts provide more information than western bar charts with OHLC (Open, High, Low, Close). This is not true.
Candlestick charts provide the same information as bar/OHLC charts despite their aesthetic appeal, ease of reading, and apparent pattern recognition for some. As you can see in the discussion above, the candlestick chart and its bar chart counterpart convey the same information. Neither is superior nor inferior.
Traders who are new to candlesticks often perceive them as mysterious. Not surprising. Inexperienced traders might believe candlesticks hold the key to unlocking the market because of the numerous YouTube videos and books available. All that matters, in the end, is what sets you to choose on your chart and not what type of chart you use.
Bottom line
Candlestick charts make it easier for traders to see forex price movements. With a candlestick chart, you can see patterns in price action and patterns in price movements more easily. The technical analysis of price patterns covers Fundamental analysis, which is equally important. To become successful in the forex market, you will still need a trading strategy and an understanding how the market works.


