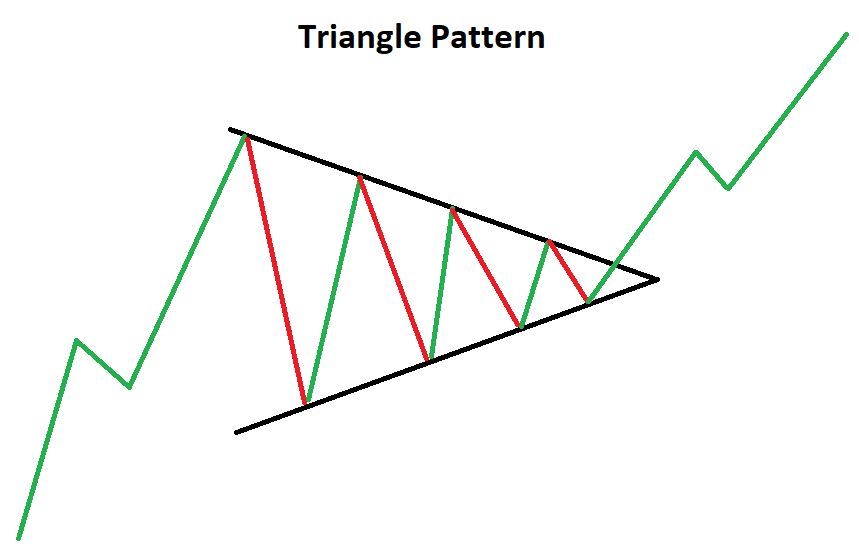
Imagine you’re at the beach, building a sandcastle. You meticulously pack the sand to create a sturdy base, but the tide keeps rolling in, nibbling away at the edges. That’s kind of what a descending triangle pattern looks like in the world of stock charts. It’s a signal that the price of an investment might be on shaky ground, and a potential downturn could be brewing.

What is a Descending Triangle?
A descending triangle is a chart pattern used by traders to identify possible downtrends. It forms like a triangle on a price chart, but unlike its cheerful cousin, the ascending triangle (which hints at an uptrend), the descending triangle points downwards. Here’s how to spot it:
- Flat Bottom: The bottom of the triangle is a horizontal line, representing a level where the price keeps finding support. Think of it as the stubborn base of your sandcastle.
- Downward Slope: The top of the triangle is a diagonal line that slopes downwards. This line connects a series of lower highs, showing that sellers are gradually pushing the price down. Imagine the tide slowly washing away the top of your sandcastle.
- Convergence: As the price keeps bouncing between these lines, the triangle gets narrower, with the trendlines converging towards a point. This signifies a potential breakout, which is the key event we’re looking for.
Decoding the Message: What Does it Mean?
A descending triangle suggests a battle between buyers and sellers. The flat bottom indicates that buyers are trying to hold the price up at a certain level. However, the downward slope shows that sellers are persistently pushing the price down, forming lower highs. This creates a sense of weakening buying pressure and a possible continuation of a downtrend.
Breakout: When the Sandcastle Crumbles
The big moment in a descending triangle comes with the breakout. This happens when the price decisively closes below the horizontal support line (the flat bottom of our sandcastle analogy). Ideally, this breakout is accompanied by a spike in trading volume, signifying a surge in selling activity and confirming the downtrend.

Where Do We Go From Here? Targeting the Price Move
Once there’s a confirmed breakout, technical analysts often use the triangle’s height to estimate a target price for the downside move. Imagine the height of your sandcastle before the tide took its toll. Here’s the gist:
- Measure the vertical distance between the top and bottom trend lines of the triangle.
- Add this height to the breakdown point (the price where the breakout occurred).
This gives you a rough estimate of where the price might head after the breakout. Remember, this is just a technical analysis tool, not a magic crystal ball. The actual price movement can deviate, so use it as a guideline, not a guaranteed outcome.
Not So Fast: False Signals and What to Watch Out For
Descending triangles, like any technical pattern, aren’t perfect predictors. Sometimes, there can be false breakouts. This is when the price dips below the support line but quickly reverses course and climbs back up. These false signals can be misleading, so it’s important to be cautious.
Here are some additional things to consider when interpreting a descending triangle:
- Overall Market Trend: Is the broader market trending upwards or downwards? A descending triangle within a downtrend is a stronger signal than one appearing during an uptrend.
- Trading Volume: Look for a surge in volume accompanying the breakout, as it strengthens the bearish signal.
- Other Technical Indicators: Don’t rely solely on the descending triangle. Combine it with other technical indicators like moving averages or momentum oscillators for a more well-rounded analysis.
Bottom Line:
While descending triangles offer a valuable compass to identify potential downtrends by understanding their formation, interpretation, and limitations, they shouldn’t be viewed as a crystal ball. Remember, confirmation from other technical indicators and market trends is crucial, as false breakouts can exist. Always prioritize sound risk management and consider fundamental analysis to form a well-rounded perspective before making investment decisions based on these signals. By using descending triangles thoughtfully alongside other tools, you can navigate the market with a greater sense of awareness and preparedness, understanding that the goal is to increase your market understanding and make informed decisions, not predict the future with absolute certainty.
(FAQs)
Is a descending triangle always bearish?
While typically seen as a bearish signal, in rare cases, a descending triangle can indicate a bullish reversal, especially if it forms at the end of a downtrend. However, this is less common.
How long does a descending triangle typically last?
The timeframe can vary depending on the security and the overall market conditions. There’s no set time frame, but some analysts look for triangles that develop over several weeks or months for better reliability.
What should I do if I see a descending triangle? A descending triangle suggests a potential downtrend. It’s a good idea to be cautious and consider reducing your investment in that asset. However, remember that technical analysis is a probabilistic approach, and confirmation from other indicators is crucial before making any investment decisions.


