2013-05-23 03:15 GMT
FOMC minutes show members open to tapering QE
The minutes from the April 30 and May 1 FOMC meeting showed that "a number" of officials expressed willingness to taper the bond buying program as early as the June meeting "if the economic information received by that time showed evidence of sufficiently strong and sustained growth". However, according to the minutes, views differed about what evidence would be necessary and the likelihood of that outcome. One Fed official wanted to stop the bond purchases immediately, while another wanted to increase the size of the program. Despite the discrepancies, most members emphasized importance of being prepared to adjust purchases either up or down.
The minutes also revealed the Fed started a review of their exit strategy principles last released to the public in 2011. The broad principles appeared generally still valid, but the bank will probably need greater flexibility regarding the details of implementing policy normalization. The greenback surged against majority of its person Wednesday after Fed Chairman Ben Bernanke hinted at possibilities of the central bank slowing its bond purchases. Initially, dollar briefly dropped across the board after Bernanke said monetary stimulus is helping the U.S.economy recovery. -FXstreet.com
FOREX ECONOMIC CALENDAR
2013-05-23 07:30 GMT
ECB President Draghi's Speech senectus
2013-05-23 08:30 GMT
Gross Domestic Product (YoY) (Q1)
2013-05-23 12:30 GMT
Initial Jobless Claims (May 17)
2013-05-23 14:00 GMT
New Home Sales (MoM) (Apr)
FOREX NEWS
2013-05-23 04:13 GMT
More volatility expected with EU PMI on tap
2013-05-23 03:32 GMT
USD/JPY turns below 103.5 on bad China data
2013-05-23 03:09 GMT
GBP/JPY edging lower towards support at 154.50
2013-05-23 03:01 GMT
AUD/NZD glued to 1.20 despite Aussie disaster

MARKET ANALYSIS – Intraday Analysis
Upwards scenario: EURUSD broke all supportive measure yesterday and currently stabilized near its lows. Appreciation above the resistive barrier at 1.2864 (R1) is compulsory to commence positive market structure and validate next intraday targets at 1.2887 (R2) and 1.2909 (R3). Downwards scenario: However our both moving averages are pointing down and if the price manages to break our key support level at 1.2824 (S1) we would expect further depreciation towards to our next targets, located at 1.2803 (S2) and 1.2781 (S3).
Resistance Levels: 1.2864, 1.2887, 1.2909
Support Levels: 1.2824, 1.2803, 1.2781

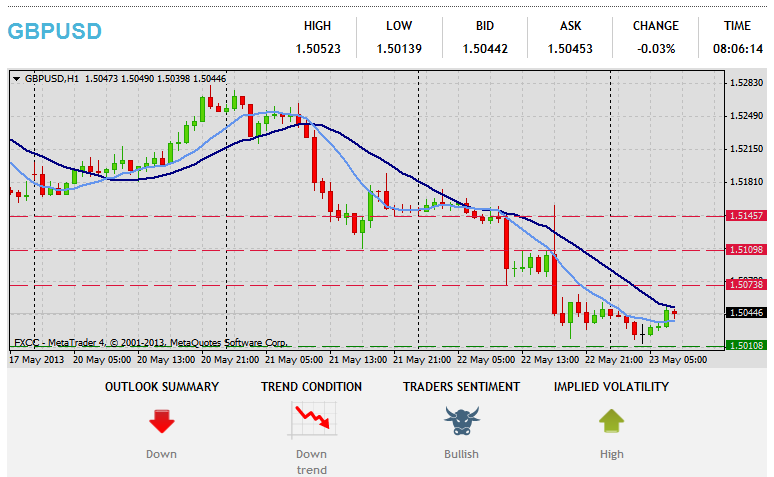
Upwards scenario: Prolonged movement yesterday on the downside determined negative bias on the short-term perspective. Though possible penetration above the resistance level at 1.0573 (R1) might keep bulls in play, targeting next resistances at 1.5109 (R2) and 1.5145 (R3). Downwards scenario: The downside direction remains favored according to the technical indicators. Our key support measure lies at 1.5010 (S1). Decline below it would enable next targets located at 1.4978 (S2) and 1.4944 (S3).
Resistance Levels: 1.5073, 1.5109, 1.5145
Support Levels: 1.5010, 1.4978, 1.4944

Upwards scenario: Price accelerates on the downside recently and likelihood of closing on the positive side today is low. However price appreciation the next resistance level at 102.25 (R1) would suggest next initial targets at 102.55 (R2) and 102.84 (R3). Downwards scenario: Next barrier on the way is seen at 101.76 (S1). Break here would open way towards to next intraday target at 101.48 (S2) and then final aim locates at 101.19 (S3).
Resistance Levels: 102.25, 102.55, 102.84
Support Levels: 101.76, 101.48, 101.19

Comments are closed.