The famous mathematician and creator of many trading indicators J. Welles Wilder, created the DMI and it featured it in his widely read and highly admired book; “New Concepts in Technical Trading Systems”.
Published in 1978 the book revealed several of his other extremely popular indicators such as; RSI (The Relative Strength Index), ATR (Average True Range) and PASR (Parabolic SAR). The DMI is still extremely popular amongst those who favor technical analysis for trading the markets. Wilder developed the DMI to trade currencies and commodities, which can often prove to be more volatile than equities and can often develop more visible trends.
His creations are mathematically sound concepts, originally created for trading off daily time frames and above, therefore it’s questionable as to how functional and accurate the indicators he developed will be in determining trends off lower time frames, such as fifteen minutes, or one hour. The standard setting suggested is 14; in effect a 14 day period.
Trading with the DMI
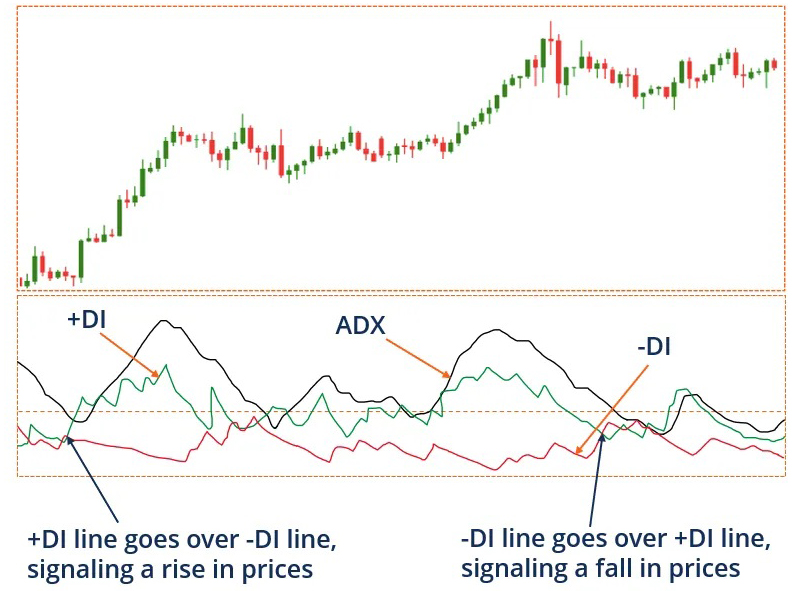
The DMI has a value between 0 and 100, its principal use is to measure the strength of a current trend. The values of +DI and -DI are used to measure direction. The basic evaluation is that during a strong trend, when the +DI is above the -DI, a bullish market is identified. When -DI is above +DI, then a bearish market is identified.
The DMI is a collection of three separate indicators, combined into creating one effective indicator. The Directional Movement Index consists of the: Average Directional Index (ADX), the Directional Indicator (+DI) and the Minus Directional Indicator (-DI). The DMI’s primary objective is to define if a strong trend is present. It’s important to note that the indicator does not take direction into account. +DI and -DI are effectively used to add purpose and confidence to the ADX. When all three are combined then (in theory) they should help to determine trend direction.
Analyzing the strength of a trend is the most popular use for the DMI. To analyze trend strength, traders would be best advised to concentrate on the ADX line, as opposed to the +DI or -DI lines.
J. Welles Wilder asserted that any DMI readings above 25, are indicative of a strong trend, conversely, a reading below 20 illustrates a weak, or a non-existent trend. Should a reading fall between these two values, then the received wisdom is that no trend is actually determined.
Cross over trading signal and basic trading technique.
Crosses are the most common uses for trading with the DMI, as DI cross-overs are the most significant trading signal consistently generated by the DMI indicator. There is a simple, yet highly effective, set of conditions suggested for trading each cross. What follows is a description of the basic rules for each trading method using the DMI.
Identifying a bullish DI cross:
- ADX over 25.
- The +DI crosses above the -DI.
- A stop loss should be set at the current day’s low, or most recent low.
- The signal strengthens as the ADX rises.
- If the ADX strengthens, traders should consider using a trailing stop.
Identifying a bearish DI cross:
- ADX must be over 25.
- The -DI crosses above the +DI.
- The stop loss should be set at the current day’s high, or most recent high.
- The signal strengthens as the ADX rises.
- If the ADX strengthens, traders should consider using a trailing stop.
Summary.
The Directional Movement Index (DMI) is another in the library of technical analysis indicators created and further developed by J. Welles Wilder. It’s not necessary important for traders to fully understand the complex subject of the maths involved, as the DMI illustrates trend strength and trend direction and calculates it, whilst delivering a very simple, straightforward visual. Many traders consider using the DMI in association with other indicators; oscillators such as the MACD, or RSI can prove to be highly effective. For example; traders may wait until they receive confirmation from both the MACD and DMI before taking a trade. Combining indicators, perhaps one trend identifying, one oscillating, is a long standing technical analysis method, successfully employed by traders over many years.