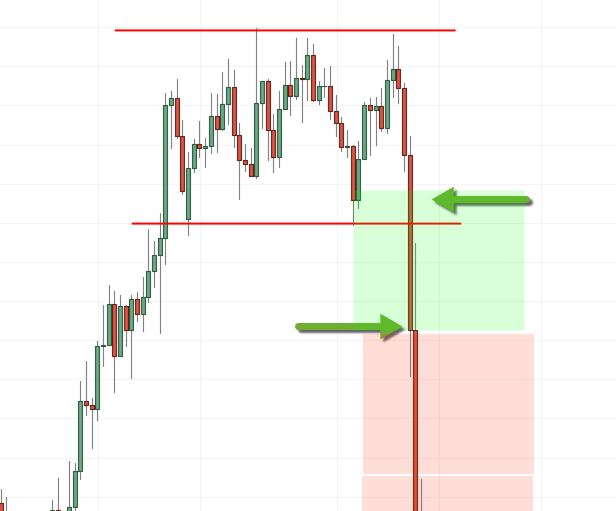
Trading breakouts and fakeouts allow traders to take positions in rising and falling markets. Breakouts can be used to find market entry positions at the beginning of a trend. Fakeouts, on the other hand, are useful for planning exits. Our article examines everything you need to know about trading breakouts and fakeouts.

What are breakouts?
The breakout situation occurs when the price of a currency pair moves above or below its resistance level. The currency pair prices then start trending in the same direction as the breakout levels.
It signals traders to place buy/long orders when prices break above the resistance level, as prices are expected to rise more.
Traders should place sell/short orders when the breakout occurs in the downward direction, below support levels.
What are fakeouts?
The term “fakeout” describes a situation in which a trader enters a market position expecting a trend, but the trend never forms. This result represents a false signal with the result that the currency pair price moves in the opposite direction.
The fakeout occurs when a currency pair tends to trade between support and resistance levels but briefly breaks out, leading to a possible breakout.
During a fakeout, when the prices move beyond the resistance level and follow a temporary uptrend, the fakeout leads to a drop in prices soon after and signals traders to short a trade.
During a fakeout, when the prices move below the support level and follow a temporary downtrend, the fakeout increases prices soon after and signals traders to long a trade.
How do you trade breakouts?
1. Determine the price levels of support and resistance
Find the support and resistance levels, which will act as extreme points beyond which a breakout can occur. Support levels are the points below which falling prices stop and rise, and resistance levels are the points above which rising prices stop rising and decreasing.

Breakouts will occur when prices fall below support.
The breakout of prices will occur when the price rises above the resistance.
2. Determine the distance between the current price and the level of support or resistance
An upward breakout is more decisive when the market price is close to a support or resistance level. It indicates a breakout in an upward direction if the current market price is close to a resistance level. It suggests a downward breakout of the current market price below the support level if it is close to the current market price.
3. Trade the breakout
Price fluctuations near these levels provide a breakout signal, confirmed by the candlestick closing above or below the resistance level.
How do you trade fakeouts?
1. Measure the distance between the price and the S&R level
Currency pair prices may have a potential fakeout if they close far from their resistance or support levels. The further away the price is from the resistance or support levels, the greater the likelihood of a strong fakeout.
2. Measure the candlestick’s wick
A candlestick’s wick size indicates the strength of its fakeout. The smaller the wick, the less likely a fakeout will occur, and the larger the wick, the greater its chances. An upper (or lower) long wick of a candlestick indicates a significant difference between a currency pair’s high (or low) price and its close (or open), resulting in a potential fakeout if the candlestick’s wick is long.
3. Measure the size of the candlestick
If long candlesticks are in the opposite direction of the breakout, it indicates a fakeout due to the market contradiction. The size of a candlestick illustrates the difference between the closing and opening prices of the candlestick. The fakeout signal is strong whenever a breakout is supported by a candlestick in the opposite direction.
Capture market trends by trading breakouts and fakeouts.
Identifying market trends and placing trade orders based on breakouts and fakeouts can help forex traders identify future trends. Start trading to increase your forex trading skills.

