
Why “tight spreads” should always come with a number attached
Search for almost any forex broker, and you’ll find the same handful of phrases: “razor thin spreads,” “unbeatable pricing,” “the tightest spreads in the industry.” Most of these have no reference point at all, tight compared to what, measured when, on which account? They sound reassuring and tell you almost nothing you can act on.
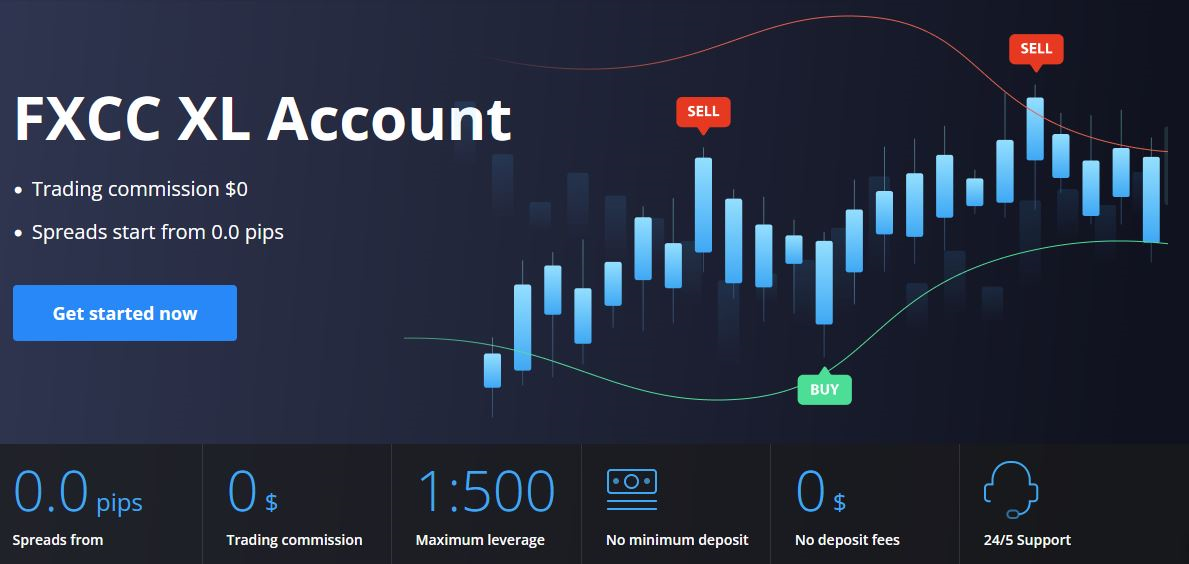
A specific number is different. “Spreads starting from 0.0 pips” is a real, checkable floor, not an empty adjective, and at FXCC, our ECN XL account genuinely hits it during peak liquidity. But a floor still isn’t the number a trader should plan a strategy around. The number that matters for deciding where to place your next hundred trades is the average, not the best moment we can point to.
That’s why we pulled live spread data from Myfxbook, which samples prices over thousands of real trading accounts, and compared FXCC’s real, measured average spreads against a wide set of competitor brokers. Here’s what that data actually shows, including where FXCC leads and where it doesn’t.
Fifteen years in an industry that doesn’t reward standing still
FXCC was founded in 2010 and has operated continuously since, serving thousands of traders worldwide.
Longevity is a genuinely meaningful signal in this industry specifically, because it’s harder to come by than the number of active brokers might suggest. Forex and CFD brokers close, lose licenses, get acquired, or rebrand under new names often enough that dedicated industry trackers exist purely to catalog defunct brokers. That’s why fifteen years of continuous operation under the same brand and the same core regulatory license aren’t a given in a market like this; they’re the result of surviving multiple market cycles and frequent regulatory tightening.
That history doesn’t mean every year has been friction-free, no broker’s is, but it does mean FXCC’s pricing and execution claims in this piece are backed by an operating track record long enough to actually test them against, not a new entrant’s marketing promises.
Why spreads matter in the first place
A spread is simply the gap between the price you can sell at and the price you can buy at, and that gap is baked into the cost of a trade before the market has even moved. If you’re only placing a handful of trades a month, a fraction of a pip won’t make much difference either way. Scalpers and day traders feel it more, though, since dozens of trades a day mean that small cost keeps showing up, again and again, standing between each entry and whatever profit might follow.
None of this makes the market itself any less risky, and a tighter spread certainly won’t turn a bad strategy into a good one. What it does is lower the threshold a trade needs to clear before it starts making money, and that’s most relevant for anyone trading frequently or working on short timeframes.
What we actually measured
We compared FXCC’s live spreads with those of a broad panel of established brokers offering similar commission-free, ECN/STP-style pricing across nine major and minor currency pairs.
Where FXCC genuinely leads
On EUR/USD, the world’s most heavily traded currency pair, FXCC’s spread compared very favorably against the group average. USD/JPY, the world’s second-most-traded pair, showed the same pattern. USD/CAD also came in ahead of average. These aren’t teaser rates on obscure crosses nobody trades; they’re three of the pairs traders use most, and FXCC’s real, measured pricing held up well against the field on all three.
Gold (XAU/USD) is worth noting as well. It’s one of the most actively traded instruments on any platform, and across a much broader sample, FXCC’s spread beat the median broker’s price, a genuine result on a genuinely significant instrument, not a thin-liquidity fluke.
A number of less commonly traded crosses also showed FXCC consistently ranked in the top third of over 150 brokers by actual spread value: CHF/SGD, NOK/JPY, AUD/SGD, USD/DKK, USD/HKD, and GBP/NOK among them.
Spreads only tell half the story; execution is the other half.
A tight spread doesn’t mean much if the price you’re quoted isn’t the price you actually get. That’s where execution matters, and it’s worth explaining plainly because the terminology is loosely used across the industry.
FXCC operates on a No Dealing Desk (NDD) model, meaning client orders are never taken on the other side of the trade by the broker. Orders are routed straight to competing liquidity providers. FXCC’s Price Aggregator scans those providers in real time to fill orders at the best available bid/ask combination. There’s no dealer sitting between the trader and the market, no discretion to hold or requote an order, and no structural conflict of interest between the broker’s book and the trader’s position.
The reason this is worth stating clearly rather than just claiming is that not every broker that markets itself as “ECN,” “STP,” or “NDD” actually delivers on it in practice; the label alone doesn’t guarantee the experience. What holds up better is independent testing. One broker review that ran live execution tests during peak London trading hours reported consistently tight spreads on major pairs, fast order matching, and no requotes when running automated strategies on MetaTrader, exactly what a genuine NDD setup should produce.

FXCC also operates multiple server locations (including New York, London, Germany, and Hong Kong) and offers free VPS hosting for qualifying accounts, both aimed at cutting the latency between a trade decision and its execution, which matters most to scalpers, algorithmic traders, and anyone trading around fast-moving news.
Tight spreads and clean execution go hand in hand. A great headline spread doesn’t do much for a trader if it comes with slippage or requotes eating up the difference. FXCC’s numbers above reflect real, tested pricing on a model built specifically to avoid that gap.
Why we’re not giving you a single “X% lower than the industry average” headline number
You’ve probably seen brokers claim something like “our spreads are 50% below the industry average,” usually attached to a specific pair. It sounds impressive. So we set out to do the real math and get to a factual, verifiable conclusion. Here’s what we found.
The percentage you get depends enormously on which group of brokers you compare against. We compared FXCC against brokers offering similar account setups and execution (commission-free, ECN/STP-style pricing rather than fixed-spread or dealing-desk models).
Comparing FXCC’s all-in spread against a raw account that also charges a separate commission would understate that broker’s real cost and produce a misleading result. Even within that kind of matched comparison, a handful of pairs, EUR/AUD among them, sat close enough to the group average that the exact percentage shifts noticeably with small changes in which brokers make the cut.
That’s the honest limit of any spread comparison. The number is only as trustworthy as the group behind it. We’d rather give you a clear, pair-by-pair picture than hand you a single impressive-sounding figure without the details behind it.
How to check any of this yourself
You don’t need to take our word, or any broker’s word, for any of this. Myfxbook’s spread comparison tool is publicly viewable and lets you select multiple brokers and pairs side by side, live. Most MetaTrader platforms also show real-time spreads directly: open Market Watch, right-click, and select “Spread” to see the live spread next to the bid and ask prices for any instrument. Watch it over a full session rather than a single glance, spreads widen during news releases and thin out during quiet periods, and a single snapshot won’t tell you what to expect on an average day.
The bottom line
FXCC’s spread pricing is genuinely strong on the pairs that matter most for volume, EUR/USD, USD/JPY, and gold. That pricing sits on top of a No Dealing Desk execution model that’s held up in independent testing: no requotes, fast fills, and orders routed straight to competing liquidity providers rather than through a dealer with a reason to work against you.
None of that fits neatly into a single marketing line, which is exactly why showing the real numbers is the point. The takeaway is simple: a broker’s pricing is not one figure, and any claim that reduces it to one should be treated as a starting point for your own check, not the final word. The takeaway is simple: use the actual spread data, not a slogan, to judge the offering.
The spread data referenced above was pulled from live Myfxbook sampling across the platform’s full broker and pair coverage. Figures show a snapshot in time; spreads are variable and change continuously with market conditions. Traders should verify current pricing directly on their trading platform before making decisions. This article is solely for informational purposes and does not constitute financial advice.