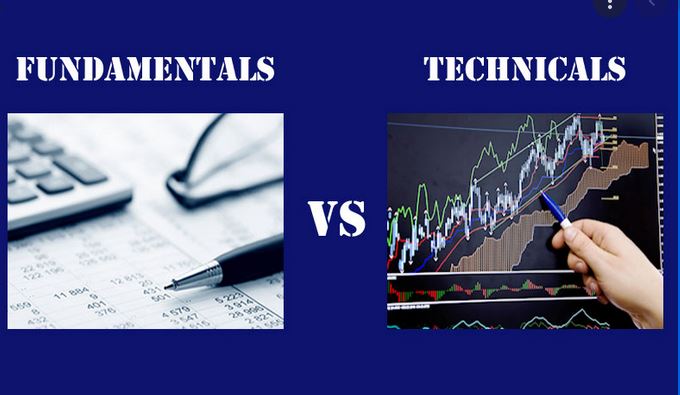
The efficacy of technical analysis has been disputed for decades, long before the invention of many of the modern day technical indicators we’re now familiar with. Whilst arguments have raged offline, long before tens of thousands of threads were created on online forums; some against, some for the use of indicators and pattern based methods of forex trading.
The main criticisms of indicators involves the observation and claim that all indicators lag, they don’t lead. They can very quickly (depending on the time frame), tell us what event has just taken place in the market through demonstrating what we term as “price action”, but they can’t predict where the market (any market) may be headed.
Many analysts and Chartists will point to candlestick formations being the most effective display and representation of price action. However, in theory we’re talking about a system for counting various commodities, created over four hundred years back, by a Chinese merchant. The modern day Frankenstein version we use on our charts, is regarded as curve fitting by many critics. The claim being that you’ll get as much price action feedback from a line chart, or from two moving averages (one fast one slow) crossing over, to indicate a change in sentiment.
Another criticism of indicators is the variance of results and the information generated, depending on the time frame selected. A trend developed on a daily time frame may be nonexistent on a lower time frame, such as the popular one hour time frame, or the higher weekly time frame. Many Chartists will drill down and scale up their charts to establish the origin and continuation of the trend, but once again this will be done retrospectively. It’s more by luck than skill that traders can identity the Big Bang of a trend’s origins on, for example, a fifteen minute chart.
The word fundamental is often defined as;
“the core, a component or fact, upon which all other aspects are built. A fundamental fact is a fact that is vital and must be known before secondary assumptions, or conclusions can be drawn.”
The importance of fundamental analysis
It’s extremely important that novice and intermediate level traders take on board the importance and relevance of this profound and prescient definition were trading is concerned, as fundamental analysis should be the bedrock upon which all your trading decisions are made. There is only one overall exception when price generally and consistently reacts to indicators; pivot point trading, when indicating changes from bearish to bullish sentiment and vice versa, but pivot point trading is a subject for another day.
It’s essential that novice traders engage in a simple exercise and form of “back testing” in order to begin to understand how fundamental economic news releases can impact price. It involves a little bit of homework, by superimposing medium and high impact news events onto our charts.
The suggestion would be to take a daily chart of, for example, a major currency pair and look for areas of key activity and price action over the past month or so. As we bring up this chart we also need to have at hand (in another window) our economic calendar. We may be able to clearly identify price movements occurring when: key PMIs have been published, interest rate decisions have been released, unemployment and job creation numbers have been announced, etc.
The probability always remains strong and steadfast, whatever time period of time frame you select; that any key price action displayed on the daily chart can be retrospectively attached to key economic calendar events. However, there is another major fundamental issue that has taken on increasing importance and relevance over recent years, which isn’t necessarily contained on conventional calendars; fast moving political events.
We may also retrospectively identify and clearly visualise areas of price action relating to political events, for example, during the constant meetings in 2011 between Merkel and Sarkozy to solve the Greece debt crises and during the overall crisis, the price of the euro would react quickly and violently. The UK’s monumental referendum decision in June 2016 to leave the European Union crashed the value of sterling. More recently in 2017 the tweets and speeches by the USA president Trump, can move the value of the dollar and equity markets in a heartbeat. Indeed, fundamentals ‘trump’ any other form of analysis given that it’s fundamentals that drive our international Forex markets.


